## Bar Chart: AI Model Performance Comparison
### Overview
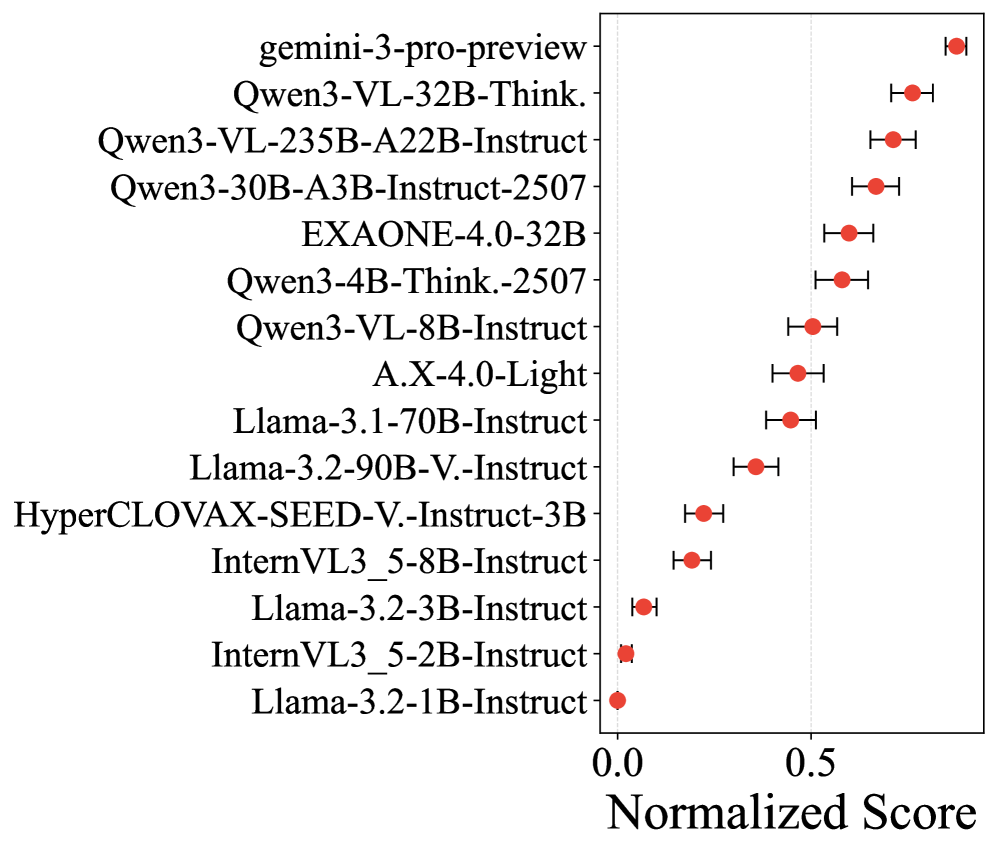
The chart compares normalized performance scores of various AI models across different architectures and configurations. Models are ranked from highest to lowest performance, with error bars indicating variability in scores.
### Components/Axes
- **Y-Axis**: AI model names (e.g., "gemini-3-pro-preview", "Qwen3-VL-32B-Think.", "Llama-3.2-1B-Instruct") listed top-to-bottom.
- **X-Axis**: "Normalized Score" ranging from 0.0 to 0.8 in 0.1 increments.
- **Data Points**: Red circles with black error bars (horizontal lines with caps) representing mean scores and confidence intervals.
- **Vertical Reference Line**: Dashed line at x=0.5.
### Detailed Analysis
1. **Highest Performing Models**:
- **gemini-3-pro-preview**: Score ≈ 0.82 (error bar ±0.03).
- **Qwen3-VL-32B-Think.**: Score ≈ 0.78 (error bar ±0.04).
- **Qwen3-VL-235B-A22B-Instruct**: Score ≈ 0.75 (error bar ±0.05).
2. **Mid-Range Models**:
- **EXAONE-4.0-32B**: Score ≈ 0.68 (error bar ±0.06).
- **Qwen3-4B-Think.-2507**: Score ≈ 0.65 (error bar ±0.07).
- **A.X-4.0-Light**: Score ≈ 0.62 (error bar ±0.08).
3. **Lower Performing Models**:
- **Llama-3.2-90B-V.-Instruct**: Score ≈ 0.55 (error bar ±0.10).
- **HyperCLOVAX-SEED-V.-Instruct-3B**: Score ≈ 0.50 (error bar ±0.12).
- **Llama-3.2-3B-Instruct**: Score ≈ 0.45 (error bar ±0.15).
- **InternVL3_5-2B-Instruct**: Score ≈ 0.40 (error bar ±0.18).
- **Llama-3.2-1B-Instruct**: Score ≈ 0.35 (error bar ±0.20).
### Key Observations
- **Performance Gradient**: Scores decrease monotonically from top (highest) to bottom (lowest) models.
- **Error Bar Variability**: Larger error bars correlate with lower scores (e.g., Llama-3.2-1B-Instruct has ±0.20 vs. gemini-3-pro-preview's ±0.03).
- **Threshold Significance**: The vertical line at 0.5 suggests a performance benchmark; 7 models exceed this threshold.
### Interpretation
The chart demonstrates a clear hierarchy in AI model effectiveness, with larger, more specialized architectures (e.g., Qwen3-VL series) outperforming smaller models. The error bars highlight reliability concerns for lower-performing models, suggesting potential overfitting or insufficient training data. The 0.5 threshold may represent a practical cutoff for deployment viability. Notably, models with "Instruct" in their names (e.g., Llama-3.2-90B-V.-Instruct) show mid-range performance, indicating instruction-tuning alone does not guarantee high scores without sufficient scale.