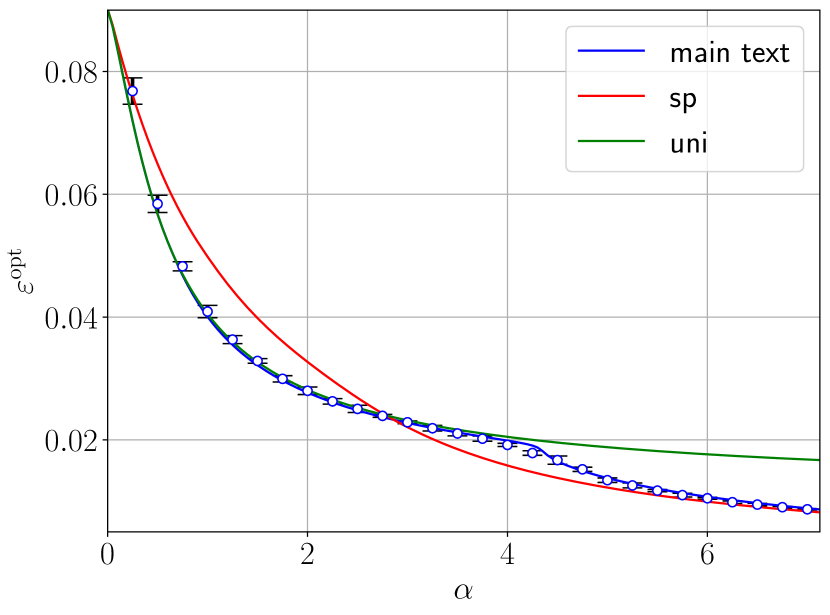
## Chart: Optimal Error vs. Alpha
### Overview
The image presents a line chart illustrating the relationship between an alpha value (α) and an optimal error (ε<sup>opt</sup>) for three different models: "main text" (blue), "sp" (red), and "uni" (green). Error bars are included for the "main text" data series. The chart aims to compare the performance of these models as the alpha parameter varies.
### Components/Axes
* **X-axis:** Labeled "α" (alpha), ranging from approximately 0 to 7. The scale is linear with tick marks at 0, 2, 4, and 6.
* **Y-axis:** Labeled "ε<sup>opt</sup>" (optimal error), ranging from approximately 0.01 to 0.09. The scale is linear with tick marks at 0.02, 0.04, 0.06, and 0.08.
* **Legend:** Located in the top-right corner, identifying the three data series:
* "main text" - Blue line with circular data points and error bars.
* "sp" - Red line.
* "uni" - Green line.
* **Data Series:** Three lines representing the relationship between α and ε<sup>opt</sup> for each model. The "main text" series includes error bars indicating the uncertainty in the optimal error value.
### Detailed Analysis
**"main text" (Blue):**
The blue line slopes downward, indicating that as α increases, the optimal error decreases. The trend is initially steep, then gradually flattens out.
* At α ≈ 0, ε<sup>opt</sup> ≈ 0.08 ± 0.002 (estimated from error bar height).
* At α ≈ 2, ε<sup>opt</sup> ≈ 0.05 ± 0.002.
* At α ≈ 4, ε<sup>opt</sup> ≈ 0.03 ± 0.002.
* At α ≈ 6, ε<sup>opt</sup> ≈ 0.01 ± 0.002.
**"sp" (Red):**
The red line also slopes downward, but it is less steep than the blue line, especially at lower α values.
* At α ≈ 0, ε<sup>opt</sup> ≈ 0.075.
* At α ≈ 2, ε<sup>opt</sup> ≈ 0.045.
* At α ≈ 4, ε<sup>opt</sup> ≈ 0.025.
* At α ≈ 6, ε<sup>opt</sup> ≈ 0.015.
**"uni" (Green):**
The green line is relatively flat compared to the other two lines. It starts at a higher ε<sup>opt</sup> value and decreases slowly with increasing α.
* At α ≈ 0, ε<sup>opt</sup> ≈ 0.085.
* At α ≈ 2, ε<sup>opt</sup> ≈ 0.06.
* At α ≈ 4, ε<sup>opt</sup> ≈ 0.04.
* At α ≈ 6, ε<sup>opt</sup> ≈ 0.025.
### Key Observations
* The "main text" model consistently exhibits the lowest optimal error across the range of α values.
* The "uni" model has the highest optimal error, particularly at lower α values.
* The "sp" model falls between the "main text" and "uni" models in terms of optimal error.
* The error bars on the "main text" data suggest a relatively consistent uncertainty in the optimal error estimate.
### Interpretation
The chart demonstrates that the optimal error (ε<sup>opt</sup>) decreases as the alpha parameter (α) increases for all three models. However, the rate of decrease varies significantly. The "main text" model appears to be the most sensitive to changes in α, achieving the lowest optimal error values. The "uni" model is the least sensitive, exhibiting a relatively flat curve and consistently higher error values.
This suggests that the "main text" model is the most effective at minimizing error as α increases, while the "uni" model's performance is less dependent on α. The "sp" model represents an intermediate performance level. The error bars on the "main text" data indicate the reliability of the optimal error estimates, suggesting a consistent level of uncertainty.
The choice of the optimal model and α value would depend on the specific application and the desired trade-off between model complexity and error minimization. The chart provides valuable insights into the performance characteristics of each model, enabling informed decision-making.