## Line Graph: ε_opt vs α
### Overview
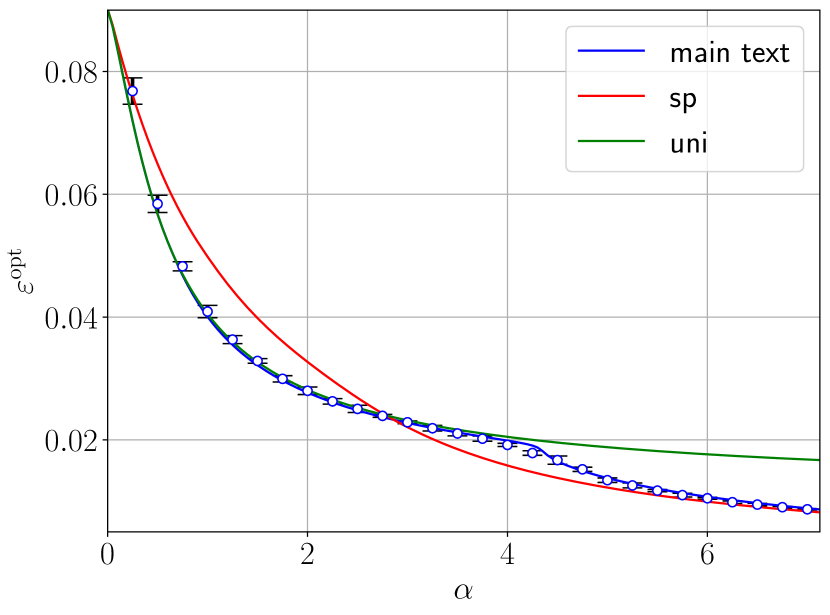
The image is a line graph depicting the relationship between the variable **α** (x-axis) and **ε_opt** (y-axis). Three data series are plotted: "main text" (blue), "sp" (red), and "uni" (green). The graph shows a general downward trend for all series as α increases, with convergence toward lower ε_opt values at higher α.
### Components/Axes
- **X-axis (α)**: Labeled as α, ranging from 0 to 6 in increments of 1.
- **Y-axis (ε_opt)**: Labeled as ε_opt, ranging from 0 to 0.08 in increments of 0.02.
- **Legend**: Located in the top-right corner, with three entries:
- Blue: "main text"
- Red: "sp"
- Green: "uni"
- **Data Points**: Marked with circular symbols (open circles for "main text" and "sp", filled circles for "uni") and error bars (small vertical lines) for uncertainty.
### Detailed Analysis
1. **Main Text (Blue Line)**:
- Starts at ε_opt ≈ 0.078 at α = 0.
- Declines steeply to ε_opt ≈ 0.012 at α = 6.
- Error bars are consistently small (~±0.002), indicating precise measurements.
2. **SP (Red Line)**:
- Begins at ε_opt ≈ 0.075 at α = 0.
- Decreases to ε_opt ≈ 0.012 at α = 6.
- Slightly less steep decline than "main text," with similar error bar magnitude.
3. **Uni (Green Line)**:
- Starts highest at ε_opt ≈ 0.085 at α = 0.
- Declines gradually to ε_opt ≈ 0.015 at α = 6.
- Error bars are minimal (~±0.001), suggesting high data reliability.
### Key Observations
- All three series exhibit a **monotonic decrease** in ε_opt as α increases.
- "Uni" consistently maintains the highest ε_opt values across all α, followed by "main text" and "sp."
- Convergence of "main text" and "sp" toward ε_opt ≈ 0.012 at α = 6 suggests similar behavior at higher α values.
- Error bars are smallest for "uni," indicating greater measurement precision for this series.
### Interpretation
The graph demonstrates that ε_opt is inversely related to α for all three categories. The "uni" series exhibits the highest baseline ε_opt and slowest decline, potentially indicating a distinct mechanism or property compared to "main text" and "sp." The convergence of "main text" and "sp" at higher α values suggests shared dependencies on α in this regime. The minimal error bars across all series imply robust experimental or computational validation of the trends. This could reflect optimization processes where increasing α reduces ε_opt, with "uni" representing a more stable or resilient system.