## Line Graphs: Frequency vs. Inner Product Distortion Across Bitwidths
### Overview
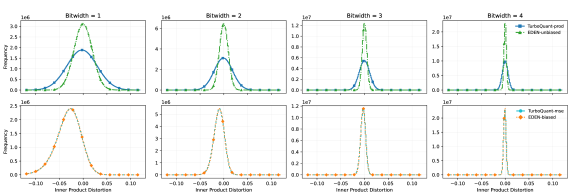
The image contains eight line graphs organized in a 2x4 grid, comparing frequency distributions of two datasets ("TurboQuant" variants and "EDDN" variants) across four bitwidths (1–4). Each graph has a y-axis labeled "Frequency" (scaled from 1e6 to 1e7) and an x-axis labeled "Inner Product Distortion" (ranging from -0.10 to 0.10). The top row compares "TurboQuant-prod" (blue) and "EDDN-unbiased" (green), while the bottom row compares "TurboQuant-err" (blue) and "EDDN-biased" (orange).
### Components/Axes
- **X-axis**: "Inner Product Distortion" (range: -0.10 to 0.10 for all graphs).
- **Y-axis**: "Frequency" (scaled logarithmically: 1e6, 1e7).
- **Legends**:
- Top row: Blue = "TurboQuant-prod", Green = "EDDN-unbiased".
- Bottom row: Blue = "TurboQuant-err", Orange = "EDDN-biased".
- **Bitwidth Labels**: Titles above each graph indicate bitwidth (1–4).
### Detailed Analysis
1. **Bitwidth = 1**
- **Top Row**:
- TurboQuant-prod (blue) peaks at ~2.5e6 frequency, centered at 0 distortion.
- EDDN-unbiased (green) peaks slightly lower (~2.0e6), with a narrower distribution.
- **Bottom Row**:
- TurboQuant-err (blue) peaks at ~2.0e6, with a broader spread.
- EDDN-biased (orange) peaks at ~1.5e6, with a flatter curve.
2. **Bitwidth = 2**
- **Top Row**:
- TurboQuant-prod peaks at ~3.0e6, EDDN-unbiased at ~2.5e6.
- **Bottom Row**:
- TurboQuant-err peaks at ~2.5e6, EDDN-biased at ~2.0e6.
3. **Bitwidth = 3**
- **Top Row**:
- TurboQuant-prod peaks at ~1.0e7, EDDN-unbiased at ~8e6.
- **Bottom Row**:
- TurboQuant-err peaks at ~8e6, EDDN-biased at ~6e6.
4. **Bitwidth = 4**
- **Top Row**:
- TurboQuant-prod peaks sharply at ~1.5e7, EDDN-unbiased at ~1.0e7.
- **Bottom Row**:
- TurboQuant-err peaks at ~1.0e7, EDDN-biased at ~8e6.
### Key Observations
- **Trend Verification**:
- TurboQuant variants (both prod and err) consistently show higher frequency peaks than their EDDN counterparts across all bitwidths.
- EDDN-biased (orange) exhibits the lowest frequency and broadest distribution, suggesting higher distortion sensitivity.
- **Outliers/Anomalies**:
- At bitwidth 4, TurboQuant-prod’s peak is exceptionally sharp, indicating minimal distortion tolerance.
- EDDN-biased (orange) shows a gradual decline in frequency as bitwidth increases, unlike TurboQuant variants.
### Interpretation
The data suggests that TurboQuant methods (prod and err) outperform EDDN variants in terms of frequency and distortion tolerance. As bitwidth increases, TurboQuant-prod demonstrates the highest efficiency, likely due to optimized error handling (prod) or error correction (err). EDDN-biased underperforms significantly, possibly due to inherent biases in its design. The logarithmic y-axis scaling highlights exponential differences in frequency, emphasizing the superiority of TurboQuant methods in high-bitwidth scenarios.