## Line Chart: R1-Llama | AMC23 Accuracy vs. Ratio
### Overview
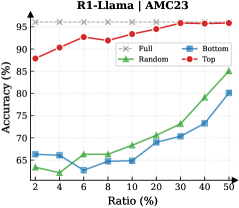
This line chart displays the accuracy of different sampling methods (Full, Random, Bottom, Top) as a function of the ratio of data used. The chart appears to be evaluating the performance of a model (R1-Llama) on a dataset (AMC23). The x-axis represents the ratio of data used, expressed as a percentage, and the y-axis represents the accuracy, also expressed as a percentage.
### Components/Axes
* **Title:** R1-Llama | AMC23
* **X-axis Label:** Ratio (%)
* **Y-axis Label:** Accuracy (%)
* **Legend:**
* Full (Grey, dashed line)
* Random (Green, solid line)
* Bottom (Blue, solid line)
* Top (Red, solid line)
* **X-axis Markers:** 2, 4, 6, 8, 10, 20, 30, 40, 50
* **Y-axis Scale:** Approximately 60% to 96%
### Detailed Analysis
The chart contains four data series, each representing a different sampling method.
* **Top (Red Line):** This line shows a generally increasing trend.
* At Ratio = 2%, Accuracy ≈ 88%
* At Ratio = 4%, Accuracy ≈ 91%
* At Ratio = 6%, Accuracy ≈ 92%
* At Ratio = 8%, Accuracy ≈ 92.5%
* At Ratio = 10%, Accuracy ≈ 93%
* At Ratio = 20%, Accuracy ≈ 94%
* At Ratio = 30%, Accuracy ≈ 94.5%
* At Ratio = 40%, Accuracy ≈ 95%
* At Ratio = 50%, Accuracy ≈ 95%
* **Bottom (Blue Line):** This line shows a generally increasing trend, but starts lower and remains below the "Top" line.
* At Ratio = 2%, Accuracy ≈ 65%
* At Ratio = 4%, Accuracy ≈ 64%
* At Ratio = 6%, Accuracy ≈ 62%
* At Ratio = 8%, Accuracy ≈ 63%
* At Ratio = 10%, Accuracy ≈ 66%
* At Ratio = 20%, Accuracy ≈ 70%
* At Ratio = 30%, Accuracy ≈ 73%
* At Ratio = 40%, Accuracy ≈ 80%
* At Ratio = 50%, Accuracy ≈ 85%
* **Random (Green Line):** This line shows a generally increasing trend, starting low and ending higher than "Bottom" but lower than "Top".
* At Ratio = 2%, Accuracy ≈ 63%
* At Ratio = 4%, Accuracy ≈ 61%
* At Ratio = 6%, Accuracy ≈ 59%
* At Ratio = 8%, Accuracy ≈ 60%
* At Ratio = 10%, Accuracy ≈ 64%
* At Ratio = 20%, Accuracy ≈ 71%
* At Ratio = 30%, Accuracy ≈ 76%
* At Ratio = 40%, Accuracy ≈ 84%
* At Ratio = 50%, Accuracy ≈ 86%
* **Full (Grey, Dashed Line):** This line is approximately flat and consistently high.
* At Ratio = 2%, Accuracy ≈ 95%
* At Ratio = 4%, Accuracy ≈ 95%
* At Ratio = 6%, Accuracy ≈ 95%
* At Ratio = 8%, Accuracy ≈ 95%
* At Ratio = 10%, Accuracy ≈ 95%
* At Ratio = 20%, Accuracy ≈ 95%
* At Ratio = 30%, Accuracy ≈ 95%
* At Ratio = 40%, Accuracy ≈ 95%
* At Ratio = 50%, Accuracy ≈ 95%
### Key Observations
* The "Top" sampling method consistently achieves the highest accuracy across all ratios.
* The "Full" sampling method maintains a very high and stable accuracy, comparable to "Top".
* The "Bottom" sampling method consistently has the lowest accuracy.
* Accuracy generally increases with increasing ratio for all sampling methods except "Full".
* The "Random" sampling method performs better than "Bottom" but worse than "Top".
### Interpretation
The data suggests that selecting the "Top" data points or using the entire dataset ("Full") yields the best performance for the R1-Llama model on the AMC23 dataset. The "Bottom" sampling method is the least effective. The increasing accuracy with ratio for "Random", "Bottom", and "Top" indicates that more data generally improves model performance, up to a point where the "Top" and "Full" methods plateau. The flat line for "Full" suggests that adding more data beyond a certain point does not significantly improve accuracy. This could be due to diminishing returns or the dataset reaching its information capacity. The difference between "Top" and "Full" is minimal, suggesting that the most informative data is concentrated in the "Top" portion of the dataset. This could be useful for reducing computational costs by only using the most relevant data. The "Random" method provides a middle ground, offering some improvement over "Bottom" without the computational cost of "Full". The consistent high performance of "Full" suggests that the model benefits from a comprehensive view of the data, but the "Top" method offers a viable alternative with comparable results.