## Line Chart: R1-Llama | AMC23
### Overview
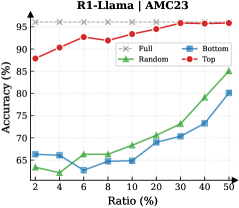
The chart compares the accuracy of four methods (Full, Bottom, Random, Top) across varying ratios (2% to 50%) on the AMC23 benchmark. The y-axis represents accuracy (%), and the x-axis represents the ratio (%). The "Full" method is the benchmark (AMC23), while the other methods show varying performance trends.
### Components/Axes
- **X-axis (Ratio %)**: Labeled "Ratio (%)", with markers at 2, 4, 6, 8, 10, 20, 30, 40, 50.
- **Y-axis (Accuracy %)**: Labeled "Accuracy (%)", with markers at 65, 70, 75, 80, 85, 90, 95.
- **Legend**: Located in the top-right corner, with four entries:
- **Full** (gray dashed line)
- **Bottom** (blue line)
- **Random** (green line)
- **Top** (red line)
### Detailed Analysis
1. **Full (Benchmark)**:
- A dashed gray line remains consistently at ~95% accuracy across all ratios.
- No significant variation; serves as the reference point.
2. **Top (Red Line)**:
- Starts at ~88% at 2%, increases steadily to ~95% by 10%, then plateaus.
- Reaches the benchmark (95%) at 10% ratio and maintains it.
3. **Random (Green Line)**:
- Begins at ~64% at 2%, dips to ~63% at 6%, then rises to ~85% at 50%.
- Shows a general upward trend with minor fluctuations.
4. **Bottom (Blue Line)**:
- Starts at ~65% at 2%, dips to ~63% at 6%, then increases to ~80% at 50%.
- Exhibits a gradual upward trend with a notable dip at 6%.
### Key Observations
- The **Full** method (AMC23) is the highest-performing, maintaining ~95% accuracy regardless of ratio.
- The **Top** method outperforms others, surpassing the benchmark at 10% ratio.
- **Random** and **Bottom** methods show improvement with higher ratios but remain below the benchmark.
- The **Random** method has a minor dip at 6% ratio (~63%), while the **Bottom** method dips slightly at the same point.
### Interpretation
The chart demonstrates that increasing the ratio improves accuracy for all non-benchmark methods, with **Top** being the most effective. The **Full** method (AMC23) acts as a static benchmark, highlighting the performance gap. The **Random** and **Bottom** methods show potential for improvement but require higher ratios to approach the benchmark. The dip in **Random** and **Bottom** at 6% ratio may indicate an anomaly or suboptimal configuration at that specific ratio. Overall, the data suggests that the **Top** method is the most efficient for achieving high accuracy, while the **Full** method represents the ideal target.