# Technical Document Extraction: Llama 33B, A100 80GB PCIe Performance Chart
## Chart Title
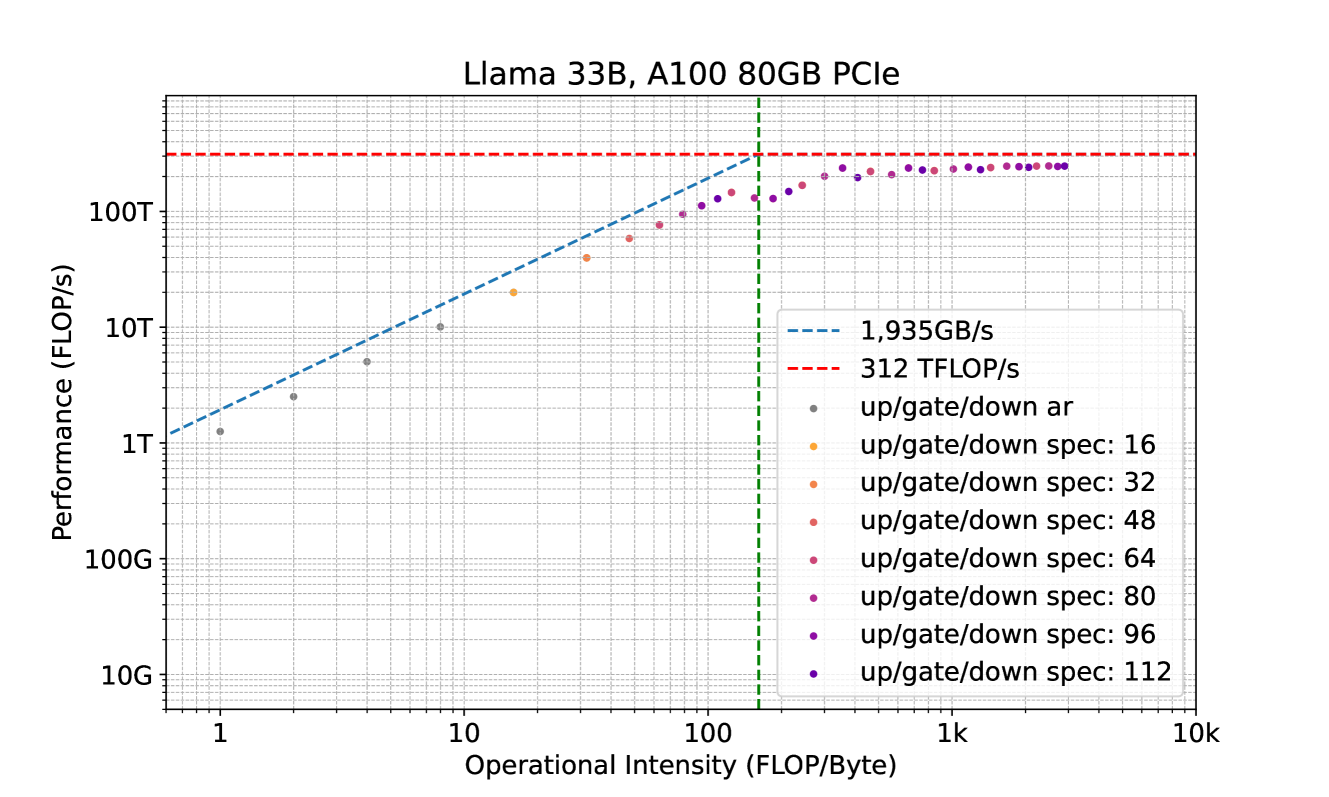
**Llama 33B, A100 80GB PCIe**
## Axes
- **X-Axis (Horizontal):**
- Label: `Operational Intensity (FLOP/Byte)`
- Range: `1` to `10k`
- Tick Markers: `1`, `10`, `100`, `1k`, `10k`
- Gridlines: Logarithmic scale
- **Y-Axis (Vertical):**
- Label: `Performance (FLOP/s)`
- Range: `10G` to `100T`
- Tick Markers: `10G`, `100G`, `1T`, `10T`, `100T`
- Gridlines: Logarithmic scale
## Key Elements
1. **Dashed Lines:**
- **Blue Dashed Line:**
- Label: `1,935GB/s`
- Purpose: Represents memory bandwidth limit.
- **Red Dashed Line:**
- Label: `312 TFLOP/s`
- Purpose: Represents peak theoretical performance limit.
2. **Vertical Green Line:**
- Position: `100 FLOP/Byte` (X-axis)
- Purpose: Threshold for operational intensity.
3. **Data Points:**
- **Markers:**
- Gray: `up/gate/down ar`
- Orange: `up/gate/down spec: 16`
- Light Orange: `up/gate/down spec: 32`
- Red: `up/gate/down spec: 48`
- Pink: `up/gate/down spec: 64`
- Purple: `up/gate/down spec: 80`
- Dark Purple: `up/gate/down spec: 96`
- Violet: `up/gate/down spec: 112`
- **Trend:**
- Performance increases with operational intensity until plateauing near the red dashed line (`312 TFLOP/s`).
- Data points cluster around the blue dashed line (`1,935GB/s`) at higher operational intensities.
## Legend
- **Color-Coded Specifications:**
- Gray: `up/gate/down ar`
- Orange: `up/gate/down spec: 16`
- Light Orange: `up/gate/down spec: 32`
- Red: `up/gate/down spec: 48`
- Pink: `up/gate/down spec: 64`
- Purple: `up/gate/down spec: 80`
- Dark Purple: `up/gate/down spec: 96`
- Violet: `up/gate/down spec: 112`
## Observations
- **Performance Scaling:**
- At low operational intensities (`<100 FLOP/Byte`), performance scales linearly with intensity.
- Beyond `100 FLOP/Byte`, performance plateaus due to hardware bottlenecks (memory bandwidth or compute limits).
- **Bottlenecks:**
- The red dashed line (`312 TFLOP/s`) acts as a hard limit for compute performance.
- The blue dashed line (`1,935GB/s`) represents the memory bandwidth ceiling, which becomes the limiting factor at higher operational intensities.
## Notes
- The chart uses a logarithmic scale for both axes to visualize performance across multiple orders of magnitude.
- Data points are plotted with distinct colors to differentiate between up/down gate specifications.
- The green vertical line at `100 FLOP/Byte` highlights a critical operational intensity threshold.