## Multi-Task Learning Performance Comparison
### Overview
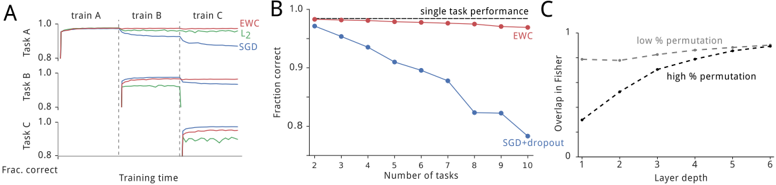
The image presents three plots (A, B, and C) comparing the performance of different machine learning algorithms in multi-task learning scenarios. Plot A shows the performance of EWC, L2 regularization, and SGD on three sequential tasks. Plot B compares the performance of EWC and SGD+dropout as the number of tasks increases. Plot C illustrates the overlap in Fisher information for different layer depths under low and high permutation conditions.
### Components/Axes
**Plot A:**
* **Title:** Implicitly, performance on sequential tasks.
* **X-axis:** Training time (no specific units).
* **Y-axis:** Frac. correct (Fraction correct), ranging from 0.8 to 1.0.
* **Tasks:** Task A, Task B, Task C (shown on the Y-axis).
* **Training Phases:** train A, train B, train C (shown at the top of the plot).
* **Algorithms:**
* EWC (red line)
* L2 (green line)
* SGD (blue line)
**Plot B:**
* **Title:** Performance vs. Number of Tasks
* **X-axis:** Number of tasks, ranging from 2 to 10.
* **Y-axis:** Fraction correct, ranging from 0.8 to 1.0.
* **Algorithms:**
* EWC (red line with circular markers)
* SGD+dropout (blue line with circular markers)
* Single task performance (black dashed line)
**Plot C:**
* **Title:** Overlap in Fisher Information vs. Layer Depth
* **X-axis:** Layer depth, ranging from 1 to 6.
* **Y-axis:** Overlap in Fisher, ranging from 0 to 1.
* **Conditions:**
* low % permutation (gray dashed line)
* high % permutation (black dashed line)
### Detailed Analysis
**Plot A:**
* **Task A:**
* EWC (red): Quickly reaches a fraction correct of approximately 0.98 and maintains it.
* L2 (green): Similar to EWC, reaching approximately 0.97.
* SGD (blue): Similar to EWC and L2, reaching approximately 0.98.
* **Task B:**
* EWC (red): Starts at approximately 0.98 and remains stable.
* L2 (green): Starts at approximately 0.97 and remains stable.
* SGD (blue): Drops to approximately 0.95.
* **Task C:**
* EWC (red): Starts at approximately 0.88 and remains stable.
* L2 (green): Starts at approximately 0.88 and remains stable.
* SGD (blue): Drops to approximately 0.82.
**Plot B:**
* **EWC (red):** Maintains a fraction correct of approximately 0.99 across all numbers of tasks, close to the single task performance (black dashed line).
* **SGD+dropout (blue):** Decreases from approximately 0.99 at 2 tasks to approximately 0.82 at 10 tasks.
**Plot C:**
* **low % permutation (gray):** Starts at approximately 0.95 and slightly increases to approximately 0.98 as layer depth increases.
* **high % permutation (black):** Starts at approximately 0.1 and increases to approximately 0.9 as layer depth increases.
### Key Observations
* In Plot A, EWC and L2 regularization perform similarly and better than SGD as new tasks are introduced. SGD's performance degrades significantly with each new task.
* In Plot B, EWC maintains high performance as the number of tasks increases, while SGD+dropout's performance decreases significantly.
* In Plot C, high permutation leads to a lower initial overlap in Fisher information, but the overlap increases more rapidly with layer depth compared to low permutation.
### Interpretation
The plots demonstrate the effectiveness of Elastic Weight Consolidation (EWC) in mitigating catastrophic forgetting in multi-task learning. EWC maintains high performance across multiple tasks by consolidating important weights, while standard SGD suffers from performance degradation as new tasks are learned. L2 regularization shows some improvement over SGD but is not as effective as EWC. The Fisher information overlap plot suggests that higher permutation rates require deeper layers to achieve comparable overlap in important parameters. This indicates that the network needs to learn more distinct representations when tasks are highly permuted.