\n
## Charts: Performance Comparison of Learning Algorithms
### Overview
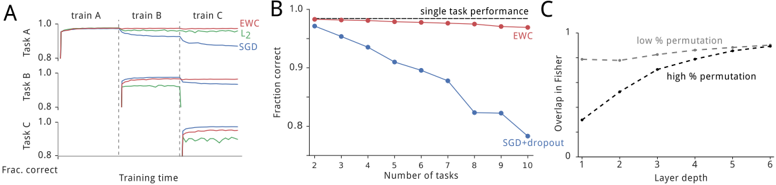
The image presents three charts (A, B, and C) comparing the performance of different learning algorithms (EWC, L2, SGD, SGD+Dropout) on sequential tasks. Chart A shows the fraction correct over training time for three tasks. Chart B shows the fraction correct for a single task as the number of tasks increases. Chart C shows the overlap in Fisher information as a function of layer depth, for low and high permutation rates.
### Components/Axes
**Chart A:**
* **X-axis:** Training time, labeled as "Training time". The x-axis is divided into sections labeled "train A", "train B", and "train C".
* **Y-axis:** Fraction correct, labeled as "Frac. correct". Scale ranges from approximately 0.6 to 1.0.
* **Data Series:**
* EWC (Elastic Weight Consolidation) - Green line
* L2 - Red line
* SGD (Stochastic Gradient Descent) - Blue line
* SGD - Black line
**Chart B:**
* **X-axis:** Number of tasks, labeled as "Number of tasks". Scale ranges from 2 to 10.
* **Y-axis:** Fraction correct, labeled as "Fraction correct". Scale ranges from approximately 0.8 to 1.0.
* **Data Series:**
* Single task performance - Red line with circular markers
* EWC - Blue line with circular markers
* SGD+Dropout - Blue line with circular markers
**Chart C:**
* **X-axis:** Layer depth, labeled as "Layer depth". Scale ranges from 0 to 6.
* **Y-axis:** Overlap in Fisher, labeled as "Overlap in Fisher". Scale ranges from 0 to 1.
* **Data Series:**
* Low % permutation - Black dashed line
* High % permutation - Black dotted line
### Detailed Analysis
**Chart A:**
* **EWC (Green):** Starts at approximately 0.95, remains relatively stable during train A, slightly decreases during train B, and then shows a slight increase during train C, ending around 0.98.
* **L2 (Red):** Starts at approximately 0.95, remains relatively stable during train A, slightly decreases during train B, and then shows a slight increase during train C, ending around 0.98.
* **SGD (Blue):** Starts at approximately 0.95, remains relatively stable during train A, slightly decreases during train B, and then shows a slight increase during train C, ending around 0.98.
* **SGD (Black):** Starts at approximately 0.95, remains relatively stable during train A, slightly decreases during train B, and then shows a slight increase during train C, ending around 0.98.
**Chart B:**
* **Single task performance (Red):** Remains relatively constant at approximately 0.98 across all number of tasks.
* **EWC (Blue):** Starts at approximately 0.97 at 2 tasks, gradually decreases to approximately 0.88 at 10 tasks. The trend is downward.
* **SGD+Dropout (Blue):** Starts at approximately 0.97 at 2 tasks, rapidly decreases to approximately 0.75 at 10 tasks. The trend is strongly downward.
**Chart C:**
* **Low % permutation (Black dashed):** Starts at approximately 0.3 at layer depth 0, gradually increases to approximately 0.8 at layer depth 6. The trend is upward.
* **High % permutation (Black dotted):** Starts at approximately 0.5 at layer depth 0, rapidly increases to approximately 0.9 at layer depth 6. The trend is strongly upward.
### Key Observations
* In Chart A, all algorithms perform similarly, maintaining high accuracy across all three tasks.
* In Chart B, single task performance remains high, while EWC and SGD+Dropout experience a decline in performance as the number of tasks increases. SGD+Dropout degrades more rapidly than EWC.
* In Chart C, the overlap in Fisher information increases with layer depth for both low and high permutation rates, with the high permutation rate showing a steeper increase.
### Interpretation
The data suggests that EWC and SGD+Dropout are methods for continual learning, attempting to learn multiple tasks sequentially without forgetting previously learned tasks. Chart A demonstrates that all algorithms can learn individual tasks effectively. However, Chart B reveals that as the number of tasks increases, the performance of EWC and especially SGD+Dropout degrades, indicating catastrophic forgetting. Single task performance remains high, serving as a baseline.
Chart C explores the relationship between layer depth and overlap in Fisher information, which is a measure of how much the parameters of the network change when learning a new task. The higher overlap with high permutation suggests that the network is more sensitive to changes in the parameters, potentially leading to greater forgetting. The increase in overlap with layer depth indicates that deeper layers are more susceptible to changes.
The combination of these charts provides insights into the trade-offs between plasticity and stability in continual learning. EWC appears to offer a better balance than SGD+Dropout, but both methods suffer from some degree of forgetting as the number of tasks increases. The permutation rate and layer depth influence the extent of this forgetting.