TECHNICAL ASSET FINGERPRINT
d430e0ffcd49838dbe4fc71e
Click to view fullscreen
Press ESC or click to close
FOUND IN PAPERS
EXPERT: healer-alpha-free VERSION 1
RUNTIME: free/openrouter/healer-alpha
INTEL_VERIFIED
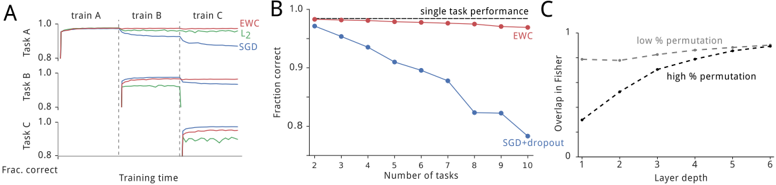
## [Multi-Panel Chart]: Performance and Overlap Analysis of Neural Network Training Methods
### Overview
The image is a composite figure containing three distinct line charts, labeled A, B, and C, arranged horizontally from left to right. The charts analyze and compare the performance and internal characteristics of different neural network training methods, specifically focusing on catastrophic forgetting and the Elastic Weight Consolidation (EWC) algorithm versus standard methods like Stochastic Gradient Descent (SGD).
### Components/Axes
**Panel A (Left):**
* **Title/Label:** "A" (top-left corner).
* **X-axis:** Labeled "Training time". It is divided into three sequential phases marked by vertical dashed lines: "train A", "train B", and "train C".
* **Y-axis:** Labeled "Frac. correct" (Fraction correct). Scale ranges from 0.8 to 1.0.
* **Legend:** Located in the top-right corner of the panel. Contains three entries:
* Red line: "EWC"
* Green line: "L2"
* Blue line: "SGD"
* **Data Series:** Three lines tracking performance on three different tasks ("Task A", "Task B", "Task C") over the course of sequential training.
**Panel B (Center):**
* **Title/Label:** "B" (top-left corner). Contains a subtitle: "single task performance".
* **X-axis:** Labeled "Number of tasks". Scale shows integer markers from 2 to 10.
* **Y-axis:** Labeled "Fraction correct". Scale ranges from 0.8 to 1.0.
* **Legend:** Located in the top-right corner of the panel. Contains two entries:
* Red line with circle markers: "EWC"
* Blue line with diamond markers: "SGD+dropout"
* **Data Series:** Two lines showing how performance on a single, original task degrades as more new tasks are learned sequentially.
**Panel C (Right):**
* **Title/Label:** "C" (top-left corner).
* **X-axis:** Labeled "Layer depth". Scale shows integer markers from 1 to 6.
* **Y-axis:** Labeled "Overlap in Fisher". Scale ranges from 0 to 1.
* **Legend/Annotations:** Text labels placed directly on the chart:
* "low % permutation" (associated with the solid line).
* "high % permutation" (associated with the dashed line).
* **Data Series:** Two lines showing the overlap in the Fisher Information Matrix across network layers under different permutation conditions.
### Detailed Analysis
**Panel A Analysis:**
* **Trend Verification:**
* **EWC (Red):** The line shows a sharp initial rise during "train A" to ~0.99, remains nearly flat and high during "train B" and "train C", indicating minimal forgetting.
* **L2 (Green):** Rises to ~0.99 during "train A". During "train B", it drops to ~0.95 and stays flat. During "train C", it drops further to ~0.85-0.88, showing moderate forgetting.
* **SGD (Blue):** Rises to ~0.99 during "train A". Experiences a significant drop to ~0.92 during "train B". Experiences another major drop to ~0.82 during "train C", showing severe catastrophic forgetting.
* **Spatial Grounding:** The vertical dashed lines clearly segment the training timeline. The legend is positioned in the upper right, away from the data lines.
**Panel B Analysis:**
* **Trend Verification:**
* **EWC (Red):** The line is nearly horizontal, starting at ~0.98 for 2 tasks and ending at ~0.97 for 10 tasks. This indicates the method preserves single-task performance almost perfectly as more tasks are added.
* **SGD+dropout (Blue):** The line shows a steady, approximately linear decline. It starts at ~0.97 for 2 tasks and falls to ~0.80 for 10 tasks. Each additional task learned causes a drop in performance on the original task.
* **Component Isolation:** The chart is simple, with the main plot area clearly showing the diverging trends of the two methods.
**Panel C Analysis:**
* **Trend Verification:**
* **low % permutation (Solid Line):** Starts at an overlap of ~0.65 at Layer 1. Increases steadily and almost linearly to ~0.95 at Layer 6.
* **high % permutation (Dashed Line):** Starts at a lower overlap of ~0.35 at Layer 1. Increases more steeply than the solid line, crossing it around Layer 3.5, and reaches a similar high overlap of ~0.95 at Layer 6.
* **Key Data Points:** The crossover point suggests that for deeper layers, the overlap in Fisher information is high regardless of permutation level, while shallower layers are more sensitive to permutation.
### Key Observations
1. **Catastrophic Forgetting Gradient:** Panel A visually demonstrates a clear hierarchy in mitigating catastrophic forgetting: EWC (best) > L2 regularization > SGD (worst).
2. **Scalability of Protection:** Panel B shows that EWC's protection of knowledge scales well with the number of tasks, while standard methods (SGD+dropout) degrade linearly.
3. **Layer-wise Sensitivity:** Panel C reveals that the similarity of important parameters (measured by Fisher overlap) between tasks is depth-dependent. Lower layers show more differentiation based on task permutation, while higher layers converge to high overlap.
### Interpretation
This figure provides a multi-faceted empirical argument for the effectiveness of the Elastic Weight Consolidation (EWC) algorithm in continual learning scenarios.
* **What the data suggests:** The data demonstrates that EWC successfully mitigates catastrophic forgetting (Panel A) and maintains high performance on previously learned tasks even as the number of tasks grows (Panel B). This is contrasted sharply with standard training techniques (SGD, L2), which suffer significant performance degradation.
* **How elements relate:** Panel C offers a potential mechanistic insight. The high overlap in Fisher information in deeper layers, especially under high permutation, suggests these layers encode more general, task-invariant features. EWC likely works by identifying and protecting the important parameters (via the Fisher matrix) in these critical, shared layers, preventing them from being overwritten when learning new tasks. The lower overlap in early layers under high permutation indicates these layers adapt more specifically to each task.
* **Notable implications:** The findings are significant for the field of artificial intelligence, particularly for developing systems that can learn sequences of tasks without forgetting prior knowledge—a key challenge in creating robust, lifelong learning agents. The charts collectively move from demonstrating the problem (A), to showing a scalable solution (B), to probing the underlying reason for its efficacy (C).
DECODING INTELLIGENCE...