## Line Graphs and Scatter Plot: Multi-Task Learning Performance and Model Robustness
### Overview
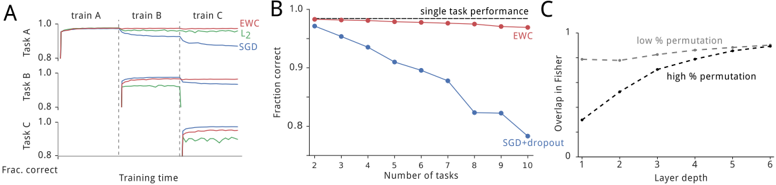
The image contains three panels (A, B, C) comparing machine learning model performance across tasks, training dynamics, and layer depth effects. Panel A shows task-specific performance over training time, Panel B compares generalization across increasing tasks, and Panel C examines layer depth effects on model overlap.
### Components/Axes
**Panel A (Task Performance Over Training Time):**
- **X-axis**: Training time (continuous scale)
- **Y-axis**: Fraction correct (0.8–1.0)
- **Lines**:
- Red: EWC (Elastic Weight Consolidation)
- Green: L2 regularization
- Blue: SGD (Stochastic Gradient Descent)
- **Legend**: Right-aligned, labels match line colors
- **Tasks**: Labeled A, B, C (horizontal markers)
**Panel B (Generalization Across Tasks):**
- **X-axis**: Number of tasks (2–10)
- **Y-axis**: Fraction correct (0.8–1.0)
- **Lines**:
- Red: EWC (flat line)
- Blue: SGD+dropout (declining line)
- **Legend**: Top-right corner
**Panel C (Layer Depth vs. Overlap):**
- **X-axis**: Layer depth (1–6)
- **Y-axis**: Overlap in Fisher (0–1)
- **Lines**:
- Dashed: Low % permutation
- Solid: High % permutation
- **Legend**: Right-aligned
### Detailed Analysis
**Panel A**:
- **EWC (red)**: Maintains near-perfect performance (≈1.0) across all tasks and training time.
- **L2 (green)**: Starts strong but drops sharply during Task B (~0.85) and Task C (~0.8).
- **SGD (blue)**: Similar to L2 but with slightly smoother declines (Task B: ~0.88, Task C: ~0.82).
- **Key Transition**: All models plateau after initial training, with EWC showing no degradation.
**Panel B**:
- **EWC (red)**: Sustains ≈0.98–1.0 fraction correct across all task counts.
- **SGD+dropout (blue)**: Declines from ~0.95 (2 tasks) to ~0.8 (10 tasks), with steepest drop between 4–8 tasks.
- **Trend**: EWC’s stability contrasts sharply with SGD+dropout’s linear decay.
**Panel C**:
- **High % permutation (solid)**: Overlap increases from ~0.1 (depth 1) to ~0.6 (depth 6).
- **Low % permutation (dashed)**: Remains flat at ~0.3 across all depths.
- **Trend**: Higher permutation correlates with increased Fisher overlap, suggesting greater layer-specific variability.
### Key Observations
1. **EWC Superiority**: Consistently outperforms L2 and SGD in multi-task settings (Panel A) and maintains performance with increasing tasks (Panel B).
2. **SGD+dropout Degradation**: Performance drops ~15% when tasks increase from 2 to 10 (Panel B).
3. **Permutation Impact**: High permutation doubles Fisher overlap compared to low permutation (Panel C), implying stronger layer differentiation.
### Interpretation
- **Task Incremental Learning**: EWC’s elastic weight consolidation mechanism prevents catastrophic forgetting, critical for real-world applications requiring continuous learning.
- **Generalization Trade-off**: SGD+dropout’s decline suggests dropout’s regularization becomes insufficient as task complexity grows.
- **Layer Depth Dynamics**: High permutation’s rising Fisher overlap (Panel C) may reflect increased sensitivity to weight perturbations, potentially explaining EWC’s robustness in deeper networks.
- **Anomaly Note**: L2’s sharper drop in Task C (Panel A) vs. SGD’s gradual decline could indicate differing regularization mechanisms under task-specific constraints.
This analysis highlights EWC’s effectiveness in preserving knowledge across tasks and layers, with permutation depth playing a key role in model interpretability and stability.