## Line Chart: Compute-matched analysis: GPQA-Physics
### Overview
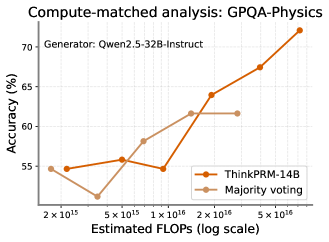
This image presents a line chart illustrating the relationship between Estimated FLOPS (on a logarithmic scale) and Accuracy (%) for two different methods: ThinkPRM-14B and Majority voting. The chart focuses on the GPQA-Physics dataset and uses data generated by Qwen2.5-32B-Instruct.
### Components/Axes
* **Title:** Compute-matched analysis: GPQA-Physics
* **Subtitle:** Generator: Qwen2.5-32B-Instruct
* **X-axis:** Estimated FLOPS (log scale). Markers are at 2 x 10<sup>15</sup>, 5 x 10<sup>15</sup>, 1 x 10<sup>16</sup>, 2 x 10<sup>16</sup>, and 5 x 10<sup>16</sup>.
* **Y-axis:** Accuracy (%). Scale ranges from approximately 54% to 72%.
* **Legend:** Located in the bottom-right corner.
* ThinkPRM-14B (represented by a solid orange line)
* Majority voting (represented by a dashed gray line)
### Detailed Analysis
**ThinkPRM-14B (Orange Line):** The line generally slopes upward, indicating increasing accuracy with increasing FLOPS.
* At 2 x 10<sup>15</sup> FLOPS, accuracy is approximately 55%.
* At 5 x 10<sup>15</sup> FLOPS, accuracy dips to approximately 53%.
* At 1 x 10<sup>16</sup> FLOPS, accuracy rises to approximately 57%.
* At 2 x 10<sup>16</sup> FLOPS, accuracy is approximately 65%.
* At 5 x 10<sup>16</sup> FLOPS, accuracy reaches approximately 71%.
**Majority Voting (Gray Dashed Line):** The line shows a more moderate increase in accuracy with increasing FLOPS.
* At 2 x 10<sup>15</sup> FLOPS, accuracy is approximately 55%.
* At 5 x 10<sup>15</sup> FLOPS, accuracy decreases to approximately 52%.
* At 1 x 10<sup>16</sup> FLOPS, accuracy rises to approximately 55%.
* At 2 x 10<sup>16</sup> FLOPS, accuracy is approximately 62%.
* At 5 x 10<sup>16</sup> FLOPS, accuracy is approximately 62%.
### Key Observations
* ThinkPRM-14B consistently outperforms Majority voting across all FLOPS levels.
* Both methods show a dip in accuracy at 5 x 10<sup>15</sup> FLOPS.
* The accuracy of Majority voting plateaus at approximately 62% after 2 x 10<sup>16</sup> FLOPS, while ThinkPRM-14B continues to improve.
* The largest gains in accuracy for ThinkPRM-14B occur between 2 x 10<sup>16</sup> and 5 x 10<sup>16</sup> FLOPS.
### Interpretation
The data suggests that ThinkPRM-14B benefits significantly from increased computational resources (FLOPS) in solving GPQA-Physics problems, demonstrating a clear positive correlation between compute and performance. Majority voting, while providing a baseline level of accuracy, shows diminishing returns with increased FLOPS. The initial dip in accuracy for both methods at 5 x 10<sup>15</sup> FLOPS could be due to noise in the data or a specific characteristic of the GPQA-Physics dataset at that computational scale. The plateauing of Majority voting suggests it reaches a performance limit, while ThinkPRM-14B continues to leverage additional compute for improved accuracy. This indicates that ThinkPRM-14B is a more scalable approach for this task. The use of Qwen2.5-32B-Instruct as the generator implies that the quality of the generated data also plays a role in the overall performance of both methods.