\n
## Statistical Data: Satisfied Clauses Statistics
### Overview
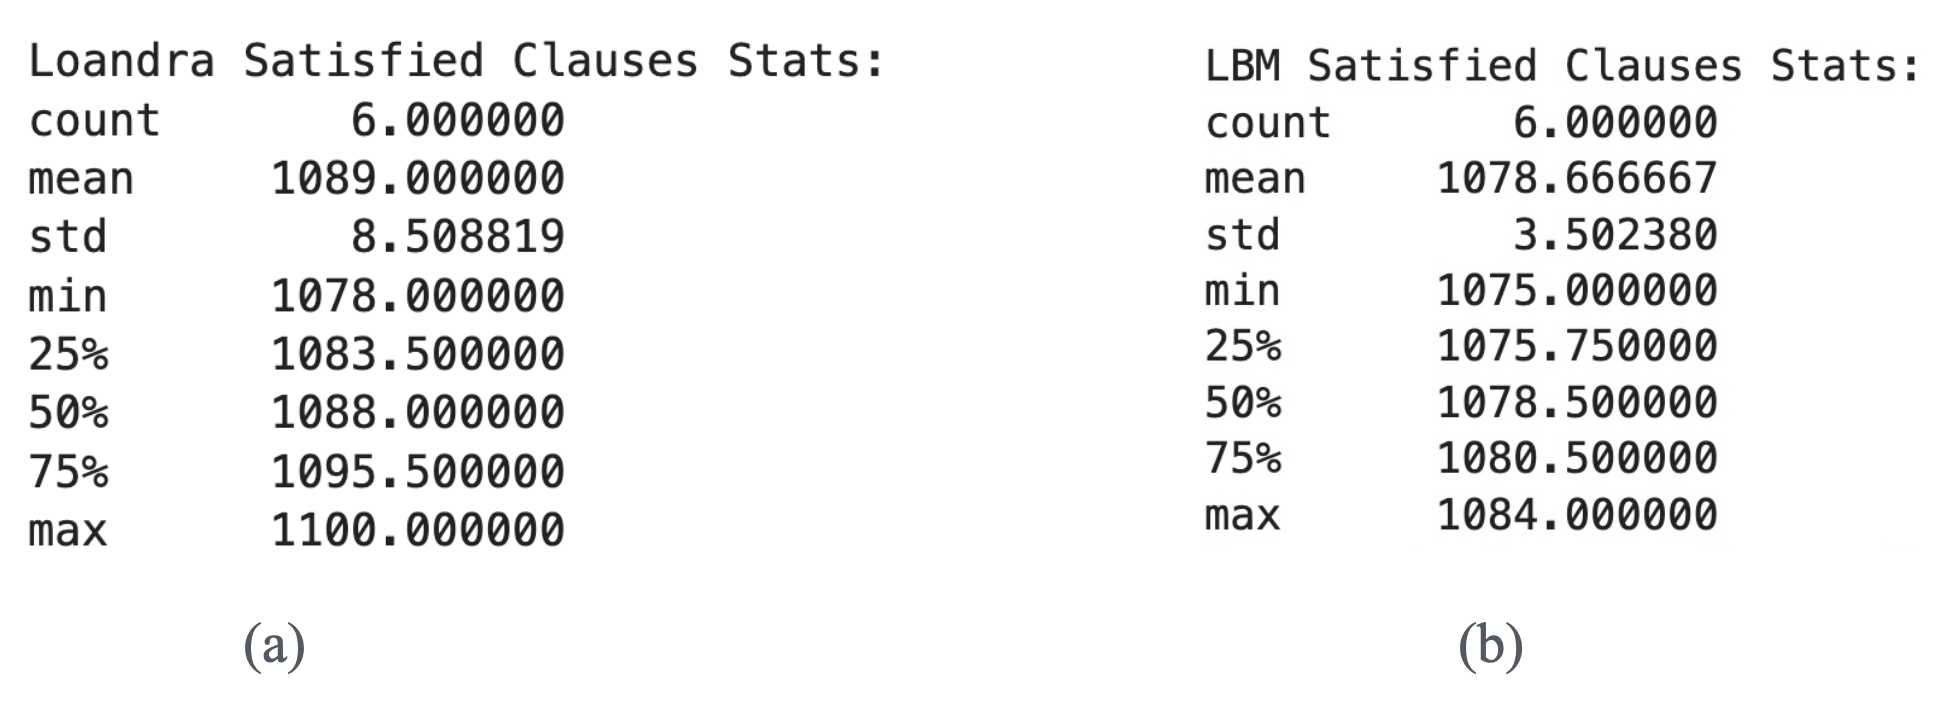
The image presents two sets of statistical data regarding "Satisfied Clauses" for two different methods: "Loandra" and "LBM". Each set includes several descriptive statistics: count, mean, standard deviation (std), minimum (min), 25th percentile, 50th percentile (median), 75th percentile, and maximum (max). The data is presented in a tabular format.
### Components/Axes
The image consists of two independent blocks of text, labeled (a) and (b) at the bottom. Each block represents the statistics for one method. The statistics are listed vertically with labels on the left and corresponding values on the right.
### Detailed Analysis or Content Details
**Loandra Satisfied Clauses Stats (a):**
* **count:** 6.000000
* **mean:** 1089.000000
* **std:** 8.508819
* **min:** 1078.000000
* **25%:** 1083.500000
* **50%:** 1088.000000
* **75%:** 1095.500000
* **max:** 1100.000000
**LBM Satisfied Clauses Stats (b):**
* **count:** 6.000000
* **mean:** 1078.666667
* **std:** 3.502380
* **min:** 1075.000000
* **25%:** 1075.750000
* **50%:** 1078.500000
* **75%:** 1080.500000
* **max:** 1084.000000
### Key Observations
* Both methods have the same count of 6.
* Loandra has a higher mean (1089.00) compared to LBM (1078.67).
* Loandra exhibits a larger standard deviation (8.51) than LBM (3.50), indicating greater variability in the number of satisfied clauses.
* The range (max - min) is wider for Loandra (1100 - 1078 = 22) than for LBM (1084 - 1075 = 9).
### Interpretation
The data suggests that, on average, Loandra satisfies more clauses than LBM. However, the satisfaction of clauses with Loandra is also more variable, as evidenced by the larger standard deviation. This could indicate that Loandra is more sensitive to the specific input or configuration, leading to a wider range of outcomes. LBM, on the other hand, appears to be more consistent in its performance, with a tighter distribution of satisfied clauses around its mean. The difference in the range of satisfied clauses further supports this observation. The small sample size (count = 6) should be considered when interpreting these results; a larger sample size would provide more robust statistical conclusions.