\n
## Statistical Summary: Comparative Analysis of Satisfied Clauses
### Overview
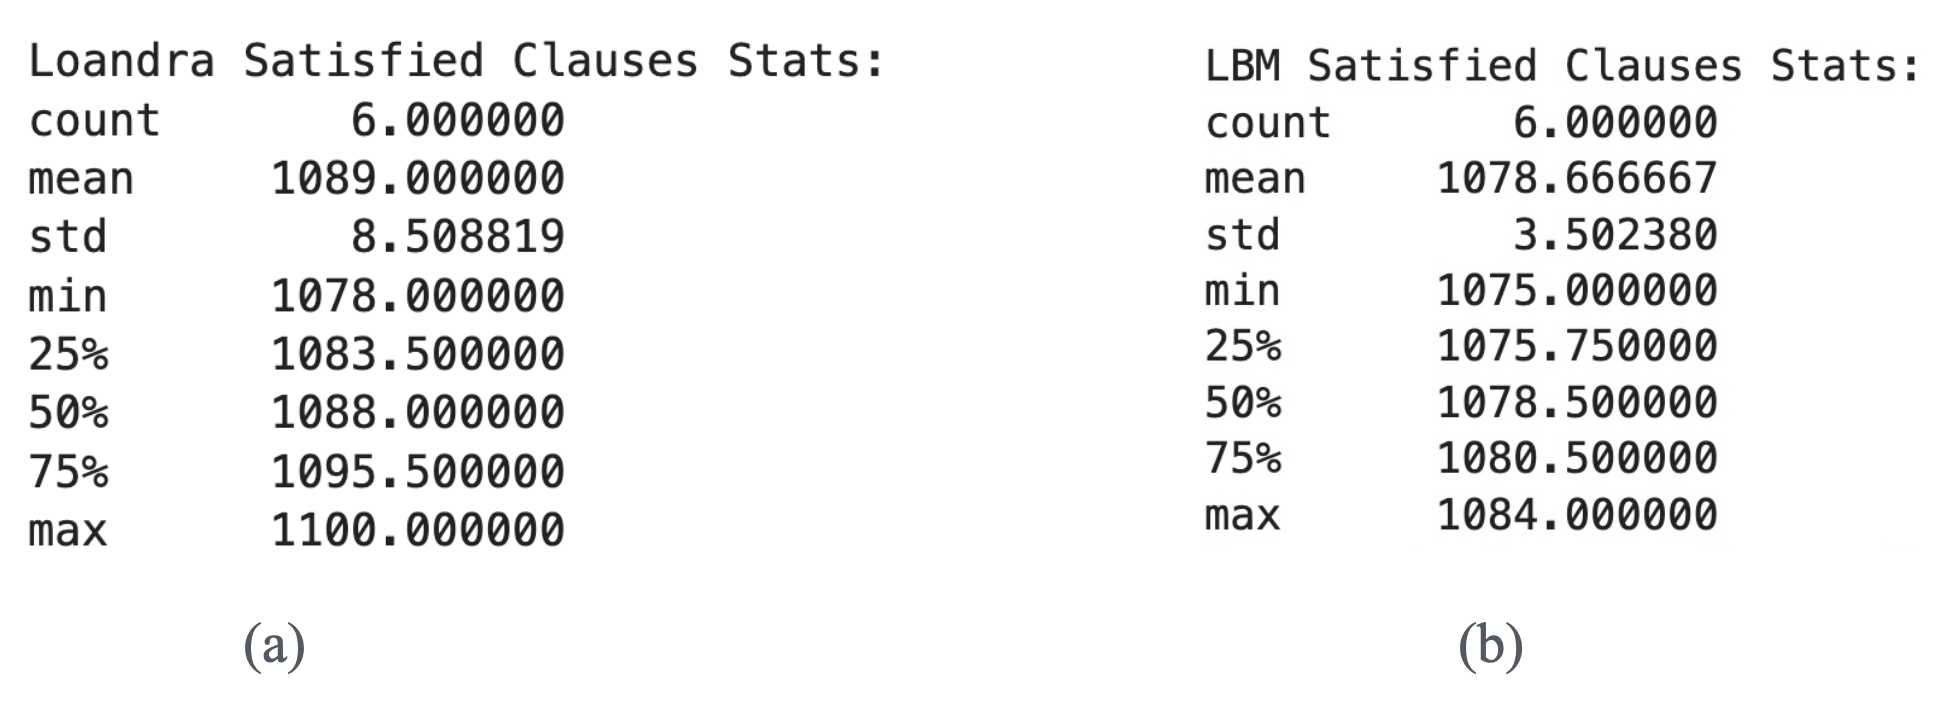
The image displays two side-by-side statistical summaries, labeled (a) and (b), presenting descriptive statistics for a metric called "Satisfied Clauses" from two different sources or models: "Loandra" and "LBM". The output appears to be from a data analysis or programming environment (e.g., Python's pandas `.describe()` output).
### Components/Axes
The image is divided into two distinct vertical sections:
* **Left Section (a):** Titled "Loandra Satisfied Clauses Stats:".
* **Right Section (b):** Titled "LBM Satisfied Clauses Stats:".
Each section contains an identical set of statistical metrics listed vertically:
* `count`
* `mean`
* `std` (Standard Deviation)
* `min` (Minimum)
* `25%` (25th Percentile / First Quartile)
* `50%` (50th Percentile / Median)
* `75%` (75th Percentile / Third Quartile)
* `max` (Maximum)
### Detailed Analysis
The following table reconstructs the precise numerical data from the image:
| Metric | Loandra (a) | LBM (b) |
| :--- | :--- | :--- |
| **count** | 6.000000 | 6.000000 |
| **mean** | 1089.000000 | 1078.666667 |
| **std** | 8.508819 | 3.502380 |
| **min** | 1078.000000 | 1075.000000 |
| **25%** | 1083.500000 | 1075.750000 |
| **50%** | 1088.000000 | 1078.500000 |
| **75%** | 1095.500000 | 1080.500000 |
| **max** | 1100.000000 | 1084.000000 |
### Key Observations
1. **Sample Size:** Both datasets have an identical count of 6 observations.
2. **Central Tendency:** The mean number of satisfied clauses for Loandra (1089.0) is higher than for LBM (~1078.67). The median (50%) follows the same pattern (1088.0 vs. 1078.5).
3. **Variability:** The standard deviation for Loandra (≈8.51) is more than double that of LBM (≈3.50), indicating significantly greater spread or inconsistency in Loandra's results.
4. **Range:** Loandra's data spans a wider range (1078 to 1100, a range of 22) compared to LBM's narrower range (1075 to 1084, a range of 9).
5. **Distribution Shape:** For Loandra, the mean (1089.0) is slightly higher than the median (1088.0), suggesting a very slight positive skew. For LBM, the mean (~1078.67) and median (1078.5) are nearly identical, suggesting a symmetric distribution.
### Interpretation
This statistical comparison suggests a clear performance trade-off between the two entities (likely algorithms, models, or systems) named "Loandra" and "LBM" regarding the "Satisfied Clauses" metric.
* **Loandra demonstrates higher average performance** but with **lower consistency**. It achieves a higher mean and median score, and its maximum value (1100) is the highest in the dataset. However, its high standard deviation and wide range indicate its performance is more variable; it can produce both high and relatively low scores (its minimum is 1078).
* **LBM demonstrates lower average performance but higher consistency and reliability.** Its scores are clustered more tightly around a lower mean, as evidenced by the low standard deviation and narrow range. Its minimum score (1075) is the lowest in the dataset, but its maximum (1084) is also significantly lower than Loandra's.
**Conclusion:** The choice between Loandra and LBM would depend on the priority. If maximizing the potential number of satisfied clauses is critical and some variability is acceptable, Loandra is the better choice. If predictable, consistent performance with minimal downside risk is the priority, LBM is preferable. The data implies Loandra might be a more powerful but less stable method, while LBM is a more conservative and stable one.