## Data Tables: Satisfied Clauses Statistics
### Overview
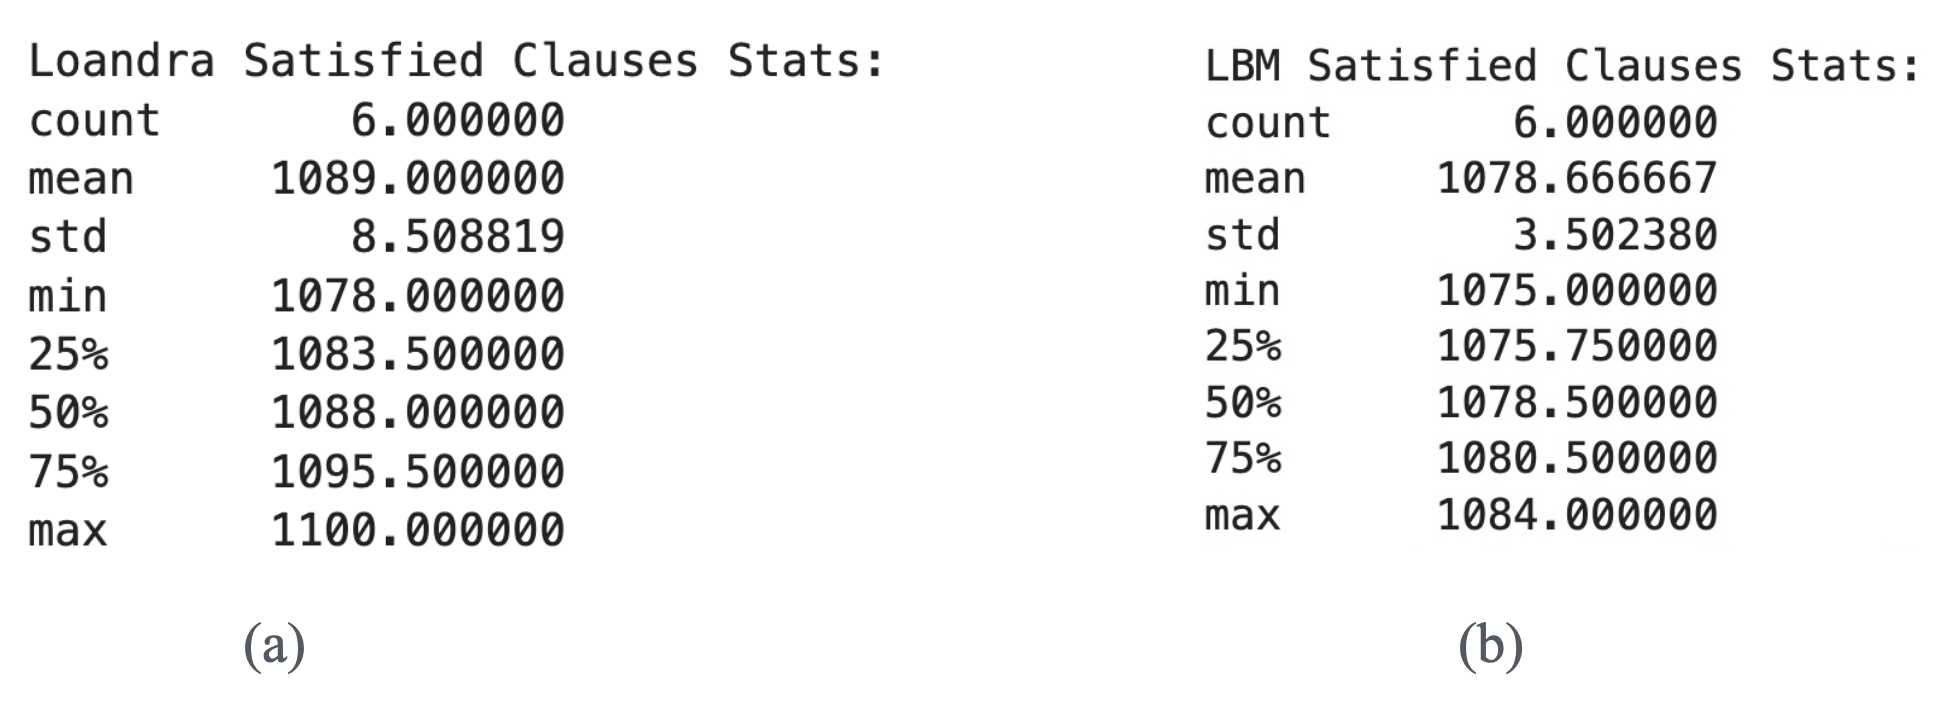
The image contains two side-by-side data tables comparing statistical metrics for "Loandra Satisfied Clauses" (a) and "LBM Satisfied Clauses" (b). Both tables include identical categories (count, mean, std, min, 25%, 50%, 75%, max) with numerical values.
### Components/Axes
- **Categories**:
- count
- mean
- std (standard deviation)
- min (minimum)
- 25% (25th percentile)
- 50% (median)
- 75% (75th percentile)
- max (maximum)
- **No legends, axes, or visual elements** are present beyond the tabular structure.
### Detailed Analysis
#### (a) Loandra Satisfied Clauses Stats
| Category | Value |
|----------|----------------|
| count | 6.000000 |
| mean | 1089.000000 |
| std | 8.508819 |
| min | 1078.000000 |
| 25% | 1083.500000 |
| 50% | 1088.000000 |
| 75% | 1095.500000 |
| max | 1100.000000 |
#### (b) LBM Satisfied Clauses Stats
| Category | Value |
|----------|----------------|
| count | 6.000000 |
| mean | 1078.666667 |
| std | 3.502380 |
| min | 1075.000000 |
| 25% | 1075.750000 |
| 50% | 1078.500000 |
| 75% | 1080.500000 |
| max | 1084.000000 |
### Key Observations
1. **Central Tendency**:
- Loandra has a higher mean (1089.0 vs. 1078.7) and max (1100.0 vs. 1084.0) compared to LBM.
- LBM’s mean is closer to its 50% percentile (1078.5), suggesting symmetry in its distribution.
2. **Variability**:
- Loandra’s standard deviation (8.51) is significantly higher than LBM’s (3.50), indicating greater dispersion in satisfied clauses.
- Loandra’s 75% percentile (1095.5) is notably higher than its median (1088.0), suggesting positive skewness.
3. **Range**:
- Loandra’s range (1078.0–1100.0) is wider than LBM’s (1075.0–1084.0).
### Interpretation
- **Loandra** exhibits higher variability and a broader spread in satisfied clauses, with a skewed distribution toward higher values. This could imply less consistency in clause satisfaction.
- **LBM** shows tighter clustering around its mean, with minimal variability, suggesting more uniform clause satisfaction.
- The higher max value for Loandra (1100.0) may indicate outliers or exceptional cases not present in LBM’s data.
- Both datasets have identical sample sizes (count = 6.0), but Loandra’s larger standard deviation suggests greater sensitivity to individual variations.
This analysis highlights differences in distribution patterns between the two systems, which could inform decisions about clause design or evaluation criteria.