\n
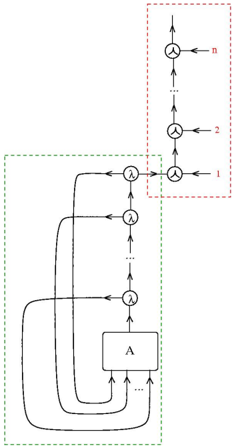
## Diagram: Iterative Process with Feedback Loops
### Overview
The image depicts a diagram illustrating an iterative process involving feedback loops and a central processing block labeled "A". The diagram is divided into two main sections, delineated by dashed rectangles: a green section representing a core iterative loop, and a red section representing a sequential progression. The diagram uses circular nodes labeled with the Greek letter lambda (λ) and numerical identifiers (1, 2, n) to represent stages in the process, with arrows indicating the flow of information or control.
### Components/Axes
The diagram consists of the following components:
* **Circular Nodes:** Represent stages or states in the process. These are labeled with "λ" and numerical identifiers (1, 2, n).
* **Block A:** A rectangular block labeled "A", representing a processing unit or function.
* **Arrows:** Indicate the direction of flow or feedback within the process.
* **Dashed Rectangles:** Define two distinct sections of the diagram: a green iterative loop and a red sequential progression.
* **Ellipsis (...):** Indicates continuation of the input arrows to block A.
There are no axes or scales present in this diagram.
### Detailed Analysis or Content Details
The diagram can be broken down into two sections:
**Green Section (Iterative Loop):**
* The core of this section consists of a series of circular nodes labeled "λ". These nodes are connected in a loop, with arrows indicating a cyclical flow.
* The bottom-most "λ" node feeds into block "A".
* Block "A" has multiple input arrows, indicated by an ellipsis (...), suggesting multiple inputs.
* Block "A" outputs to the "λ" node above it, creating a feedback loop.
* The loop continues with arrows connecting the "λ" nodes in a cascading manner.
**Red Section (Sequential Progression):**
* This section consists of a series of circular nodes labeled "1", "2", and "n", arranged vertically.
* Arrows indicate a sequential flow from node "1" to node "2" to node "n".
* The output of the green section (the top-most "λ" node) feeds into node "1" of the red section.
**Specific Flow:**
1. The iterative loop (green section) processes information and outputs to node "1" (red section).
2. Node "1" passes the information to node "2".
3. Node "2" passes the information to node "n".
4. Node "n" represents the final stage of the sequential progression.
5. The output of block "A" feeds back into the iterative loop, influencing subsequent iterations.
### Key Observations
* The diagram highlights a process that involves both iterative refinement (green section) and sequential progression (red section).
* The feedback loop within the green section suggests a process of continuous improvement or adjustment.
* The sequential progression in the red section indicates a defined order of operations or stages.
* The connection between the two sections suggests that the iterative process informs the sequential progression.
### Interpretation
The diagram likely represents a control system or algorithm where a core process (block A) is repeatedly refined through feedback loops (green section) before being applied to a sequential series of steps (red section). The iterative loop allows for adjustments and optimizations based on the output of block A, while the sequential progression ensures a consistent and ordered execution of the final result. The "n" in the red section suggests that the sequential process can be extended to an arbitrary number of steps.
The diagram is abstract and does not provide specific details about the nature of the process or the meaning of the labels "λ" and "A". However, it effectively communicates the overall structure and flow of the system. It could represent a machine learning algorithm, a control system in engineering, or a complex data processing pipeline. The diagram emphasizes the importance of feedback and iteration in achieving a desired outcome.