## Flowchart Diagram: Control and Data Flow Processes
### Overview
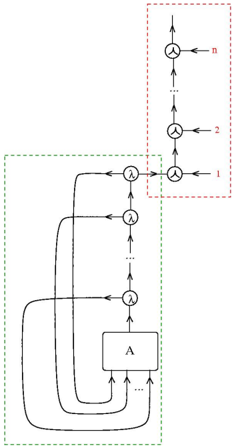
The diagram illustrates two interconnected processes: a **Control Flow** sequence (top-right red box) and a **Data Flow** network (bottom-left green box). The Control Flow is a linear sequence, while the Data Flow involves iterative transformations and a central processing unit labeled "A".
---
### Components/Axes
1. **Control Flow (Red Box)**:
- **Nodes**: Labeled `n`, `2`, `1` in descending order.
- **Arrows**: Vertical downward arrows connecting nodes, indicating sequential execution.
- **Title**: "Control Flow" (top of the red box).
2. **Data Flow (Green Box)**:
- **Lambda Nodes**: Multiple instances of `λ` (lambda symbols) arranged in a loop-like structure.
- **Central Block**: Labeled "A", with multiple incoming and outgoing arrows.
- **Arrows**: Bidirectional and unidirectional connections between lambda nodes and "A".
- **Title**: "Data Flow" (top of the green box).
3. **Legend/Annotations**:
- No explicit legend, but arrow directions imply flow logic.
- Node labels (`n`, `2`, `1`, `λ`, `A`) are directly embedded in the diagram.
---
### Detailed Analysis
- **Control Flow**:
- Starts at `n` (top node) and progresses sequentially to `1` (bottom node).
- No branching or feedback loops; strictly linear.
- **Data Flow**:
- **Lambda Nodes**: Represent transformation steps. Multiple `λ` nodes feed into each other and into "A".
- **Central Block "A"**:
- Receives input from all lambda nodes.
- Outputs to multiple downstream processes (arrows exiting "A" point to unspecified targets).
- **Feedback Loop**: One lambda node (bottom-left) loops back to an earlier `λ` node, suggesting iterative processing.
---
### Key Observations
1. **Control Flow Simplicity**: The red box represents a straightforward, deterministic sequence (e.g., a loop counter from `n` to `1`).
2. **Data Flow Complexity**: The green box shows a distributed, parallelizable process with feedback, typical of algorithms requiring iterative refinement.
3. **Centralized Processing**: "A" acts as a bottleneck or aggregation point, receiving all transformed data from the lambda nodes.
---
### Interpretation
- **Control vs. Data Flow**: The diagram contrasts a simple control mechanism (red box) with a complex data-processing pipeline (green box). The control flow likely governs the number of iterations (`n`), while the data flow handles the actual computation.
- **Role of "A"**: The central block "A" could represent a critical operation (e.g., aggregation, decision-making, or output generation) that depends on all prior transformations.
- **Feedback Mechanism**: The loop in the data flow suggests adaptive or recursive behavior, such as refining results until convergence.
This diagram likely models a computational workflow where control logic (e.g., loop iterations) orchestrates a multi-stage data transformation process culminating in a centralized operation.