## Bar Chart: Model Accuracy Comparison
### Overview
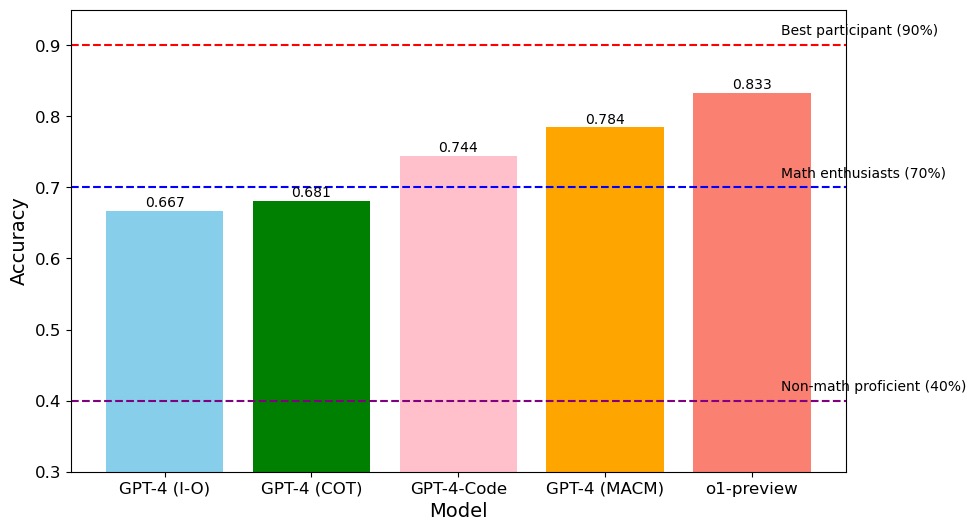
The image is a bar chart comparing the accuracy of different models: GPT-4 (I-O), GPT-4 (COT), GPT-4-Code, GPT-4 (MACM), and o1-preview. The chart also includes horizontal dashed lines representing the accuracy levels of "Best participant (90%)", "Math enthusiasts (70%)", and "Non-math proficient (40%)".
### Components/Axes
* **X-axis:** "Model" with categories: GPT-4 (I-O), GPT-4 (COT), GPT-4-Code, GPT-4 (MACM), o1-preview.
* **Y-axis:** "Accuracy" ranging from 0.3 to 0.9.
* **Horizontal Dashed Lines:**
* Red dashed line at 0.9, labeled "Best participant (90%)".
* Blue dashed line at 0.7, labeled "Math enthusiasts (70%)".
* Purple dashed line at 0.4, labeled "Non-math proficient (40%)".
### Detailed Analysis
* **GPT-4 (I-O):** Light blue bar with an accuracy of approximately 0.667.
* **GPT-4 (COT):** Green bar with an accuracy of approximately 0.681.
* **GPT-4-Code:** Pink bar with an accuracy of approximately 0.744.
* **GPT-4 (MACM):** Orange bar with an accuracy of approximately 0.784.
* **o1-preview:** Salmon bar with an accuracy of approximately 0.833.
### Key Observations
* The o1-preview model has the highest accuracy (0.833) among the models compared.
* GPT-4 (I-O) has the lowest accuracy (0.667).
* GPT-4-Code is the first model to exceed the "Math enthusiasts (70%)" accuracy level.
* No model reaches the "Best participant (90%)" accuracy level.
### Interpretation
The bar chart provides a comparison of the accuracy of different models, likely in a specific task or dataset. The horizontal lines representing different performance levels (Best participant, Math enthusiasts, Non-math proficient) provide context for evaluating the models' performance. The o1-preview model outperforms the other GPT-4 variants in terms of accuracy. The models' performance relative to the human performance benchmarks suggests areas for improvement, particularly in reaching the "Best participant" level.