\n
## Bar Chart: AI Model Accuracy Comparison
### Overview
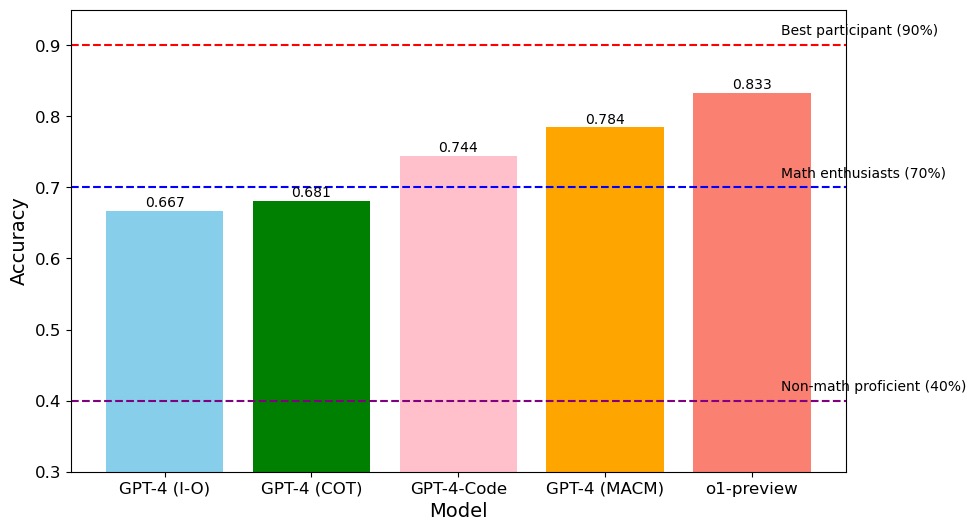
This image is a vertical bar chart comparing the accuracy scores of five different AI models on a specific task. The chart also includes three horizontal dashed lines representing human performance benchmarks for different groups. The overall trend shows increasing accuracy from left to right across the models.
### Components/Axes
* **Chart Type:** Vertical Bar Chart.
* **X-Axis (Horizontal):**
* **Title:** "Model"
* **Categories (from left to right):** "GPT-4 (I-O)", "GPT-4 (COT)", "GPT-4-Code", "GPT-4 (MACM)", "o1-preview".
* **Y-Axis (Vertical):**
* **Title:** "Accuracy"
* **Scale:** Linear scale from 0.3 to 0.9, with major tick marks at 0.3, 0.4, 0.5, 0.6, 0.7, 0.8, and 0.9.
* **Data Series (Bars):** Five colored bars, each representing a model's accuracy score. The exact numerical value is printed above each bar.
* **Benchmark Lines (Horizontal Dashed Lines):**
1. **Top Line (Dark Red):** Positioned at y=0.9. Label (right-aligned): "Best participant (90%)".
2. **Middle Line (Dark Blue):** Positioned at y=0.7. Label (right-aligned): "Math enthusiasts (70%)".
3. **Bottom Line (Purple):** Positioned at y=0.4. Label (right-aligned): "Non-math proficient (40%)".
### Detailed Analysis
**Model Performance (from left to right):**
1. **GPT-4 (I-O):** Light blue bar. Accuracy = **0.667**. This is the lowest score among the five models. It falls below the "Math enthusiasts" benchmark (0.7).
2. **GPT-4 (COT):** Dark green bar. Accuracy = **0.681**. Slightly higher than GPT-4 (I-O), but still below the 0.7 benchmark.
3. **GPT-4-Code:** Light pink bar. Accuracy = **0.744**. This is the first model to surpass the "Math enthusiasts" benchmark (0.7).
4. **GPT-4 (MACM):** Orange bar. Accuracy = **0.784**. Shows a continued increase in performance.
5. **o1-preview:** Salmon/light red bar. Accuracy = **0.833**. This is the highest-performing model in the chart. It significantly exceeds the "Math enthusiasts" benchmark and approaches, but does not reach, the "Best participant" benchmark (0.9).
**Trend Verification:** The visual trend is a clear, step-wise increase in bar height (accuracy) from left to right. Each subsequent model has a higher accuracy score than the previous one.
### Key Observations
* **Performance Hierarchy:** There is a clear ranking: o1-preview > GPT-4 (MACM) > GPT-4-Code > GPT-4 (COT) > GPT-4 (I-O).
* **Benchmark Crossings:** The first two models (I-O and COT) perform below the "Math enthusiasts" human benchmark. The last three models (Code, MACM, o1-preview) all perform above this benchmark.
* **Gap to Top Performance:** Even the best model (o1-preview, 0.833) has a notable gap (0.067 or ~6.7 percentage points) to the "Best participant" benchmark of 0.9.
* **Consistent Progression:** The improvement between models is relatively consistent, with jumps of approximately +0.014, +0.063, +0.040, and +0.049 between consecutive models.
### Interpretation
This chart demonstrates the progression of capability across different versions or prompting strategies of advanced AI models on a quantitative task (likely mathematical or reasoning-based, given the human benchmarks).
* **What the data suggests:** The data suggests that iterative improvements in model architecture or prompting techniques (from basic I-O to Chain-of-Thought (COT), specialized coding, MACM, and finally the o1-preview model) yield measurable gains in accuracy. The o1-preview model represents a significant leap, closing much of the gap between AI and top-tier human performance.
* **How elements relate:** The benchmark lines provide crucial context. They show that while early model variants were below the level of a human math enthusiast, recent variants have surpassed that level. The chart tells a story of AI catching up to, and in some cases exceeding, specific human proficiency levels.
* **Notable patterns/anomalies:** The most striking pattern is the monotonic increase in accuracy. There are no dips or outliers in the trend, indicating a clear and directed improvement path. The largest single improvement occurs between GPT-4 (COT) and GPT-4-Code (+0.063), suggesting that the "Code" variant or its associated training was particularly effective for this task. The final model, o1-preview, does not yet match the "Best participant," indicating that a performance ceiling for AI on this task has not been reached, or that there remains a qualitative gap between AI and the very best human problem-solvers.