## Line Chart: Pass@k vs. k for Different Models
### Overview
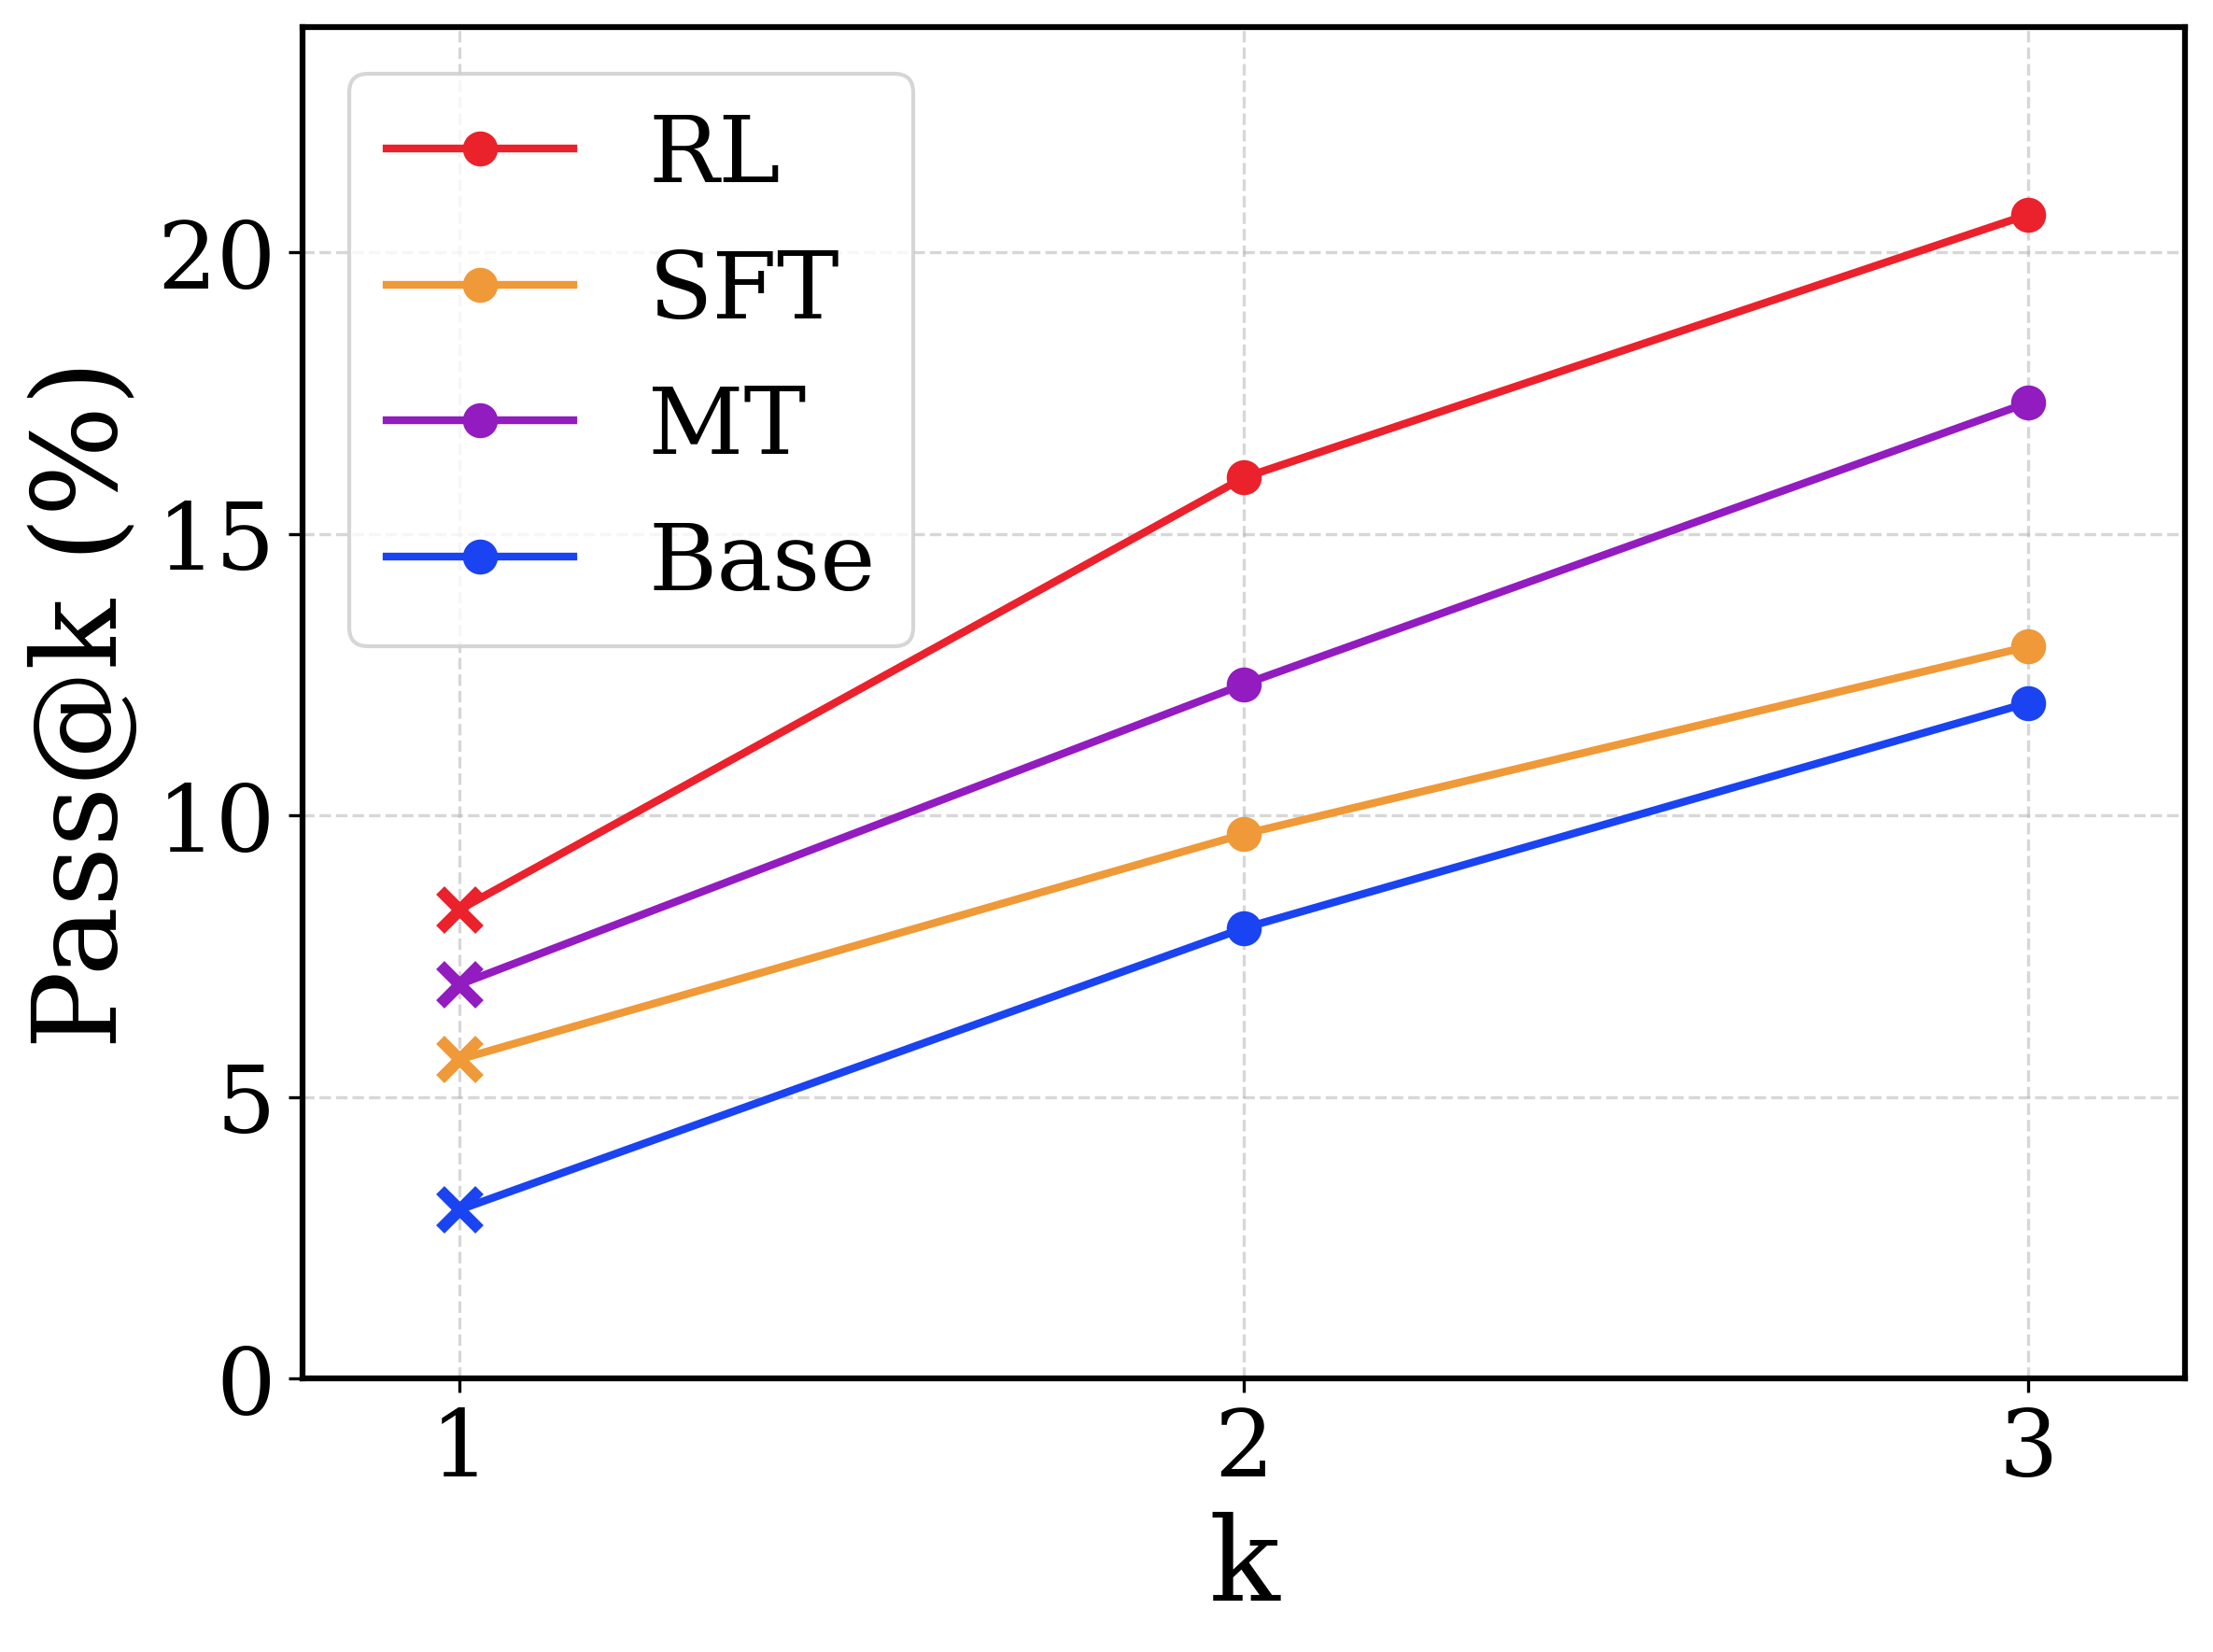
The image is a line chart comparing the performance of four different models (RL, SFT, MT, and Base) based on the "Pass@k" metric for varying values of 'k'. The chart displays the relationship between 'k' (x-axis) and "Pass@k (%)" (y-axis) for each model.
### Components/Axes
* **X-axis:** 'k' with values 1, 2, and 3.
* **Y-axis:** "Pass@k (%)" ranging from 0 to 20, with tick marks at intervals of 5 (0, 5, 10, 15, 20).
* **Legend:** Located in the top-right corner, associating each model with a specific color:
* RL: Red
* SFT: Orange
* MT: Purple
* Base: Blue
* **Gridlines:** Light gray, dashed gridlines are present in the background.
### Detailed Analysis
* **RL (Red):** The red line represents the RL model. It shows an upward trend.
* k=1: Pass@k ≈ 8% (marked with an 'x')
* k=2: Pass@k ≈ 16% (marked with a circle)
* k=3: Pass@k ≈ 21% (marked with a circle)
* **SFT (Orange):** The orange line represents the SFT model. It shows an upward trend.
* k=1: Pass@k ≈ 6% (marked with an 'x')
* k=2: Pass@k ≈ 9% (marked with a circle)
* k=3: Pass@k ≈ 13% (marked with a circle)
* **MT (Purple):** The purple line represents the MT model. It shows an upward trend.
* k=1: Pass@k ≈ 7% (marked with an 'x')
* k=2: Pass@k ≈ 12% (marked with a circle)
* k=3: Pass@k ≈ 17% (marked with a circle)
* **Base (Blue):** The blue line represents the Base model. It shows an upward trend.
* k=1: Pass@k ≈ 3% (marked with an 'x')
* k=2: Pass@k ≈ 8% (marked with a circle)
* k=3: Pass@k ≈ 12% (marked with a circle)
### Key Observations
* The RL model consistently outperforms the other models across all values of 'k'.
* The Base model consistently shows the lowest performance.
* All models exhibit an increase in "Pass@k" as 'k' increases.
* The gap between the RL model and the other models appears to widen as 'k' increases.
### Interpretation
The chart demonstrates that the RL model has the highest "Pass@k" performance compared to SFT, MT, and Base models for the given values of 'k'. The upward trend for all models suggests that increasing 'k' generally improves the "Pass@k" metric, indicating a higher probability of finding a correct solution within the top 'k' attempts. The RL model's superior performance suggests it is more effective at generating correct solutions compared to the other models. The widening gap between RL and the other models as 'k' increases implies that RL's advantage becomes more pronounced with more attempts allowed.