# Technical Document Extraction: Line Chart Analysis
## Chart Overview
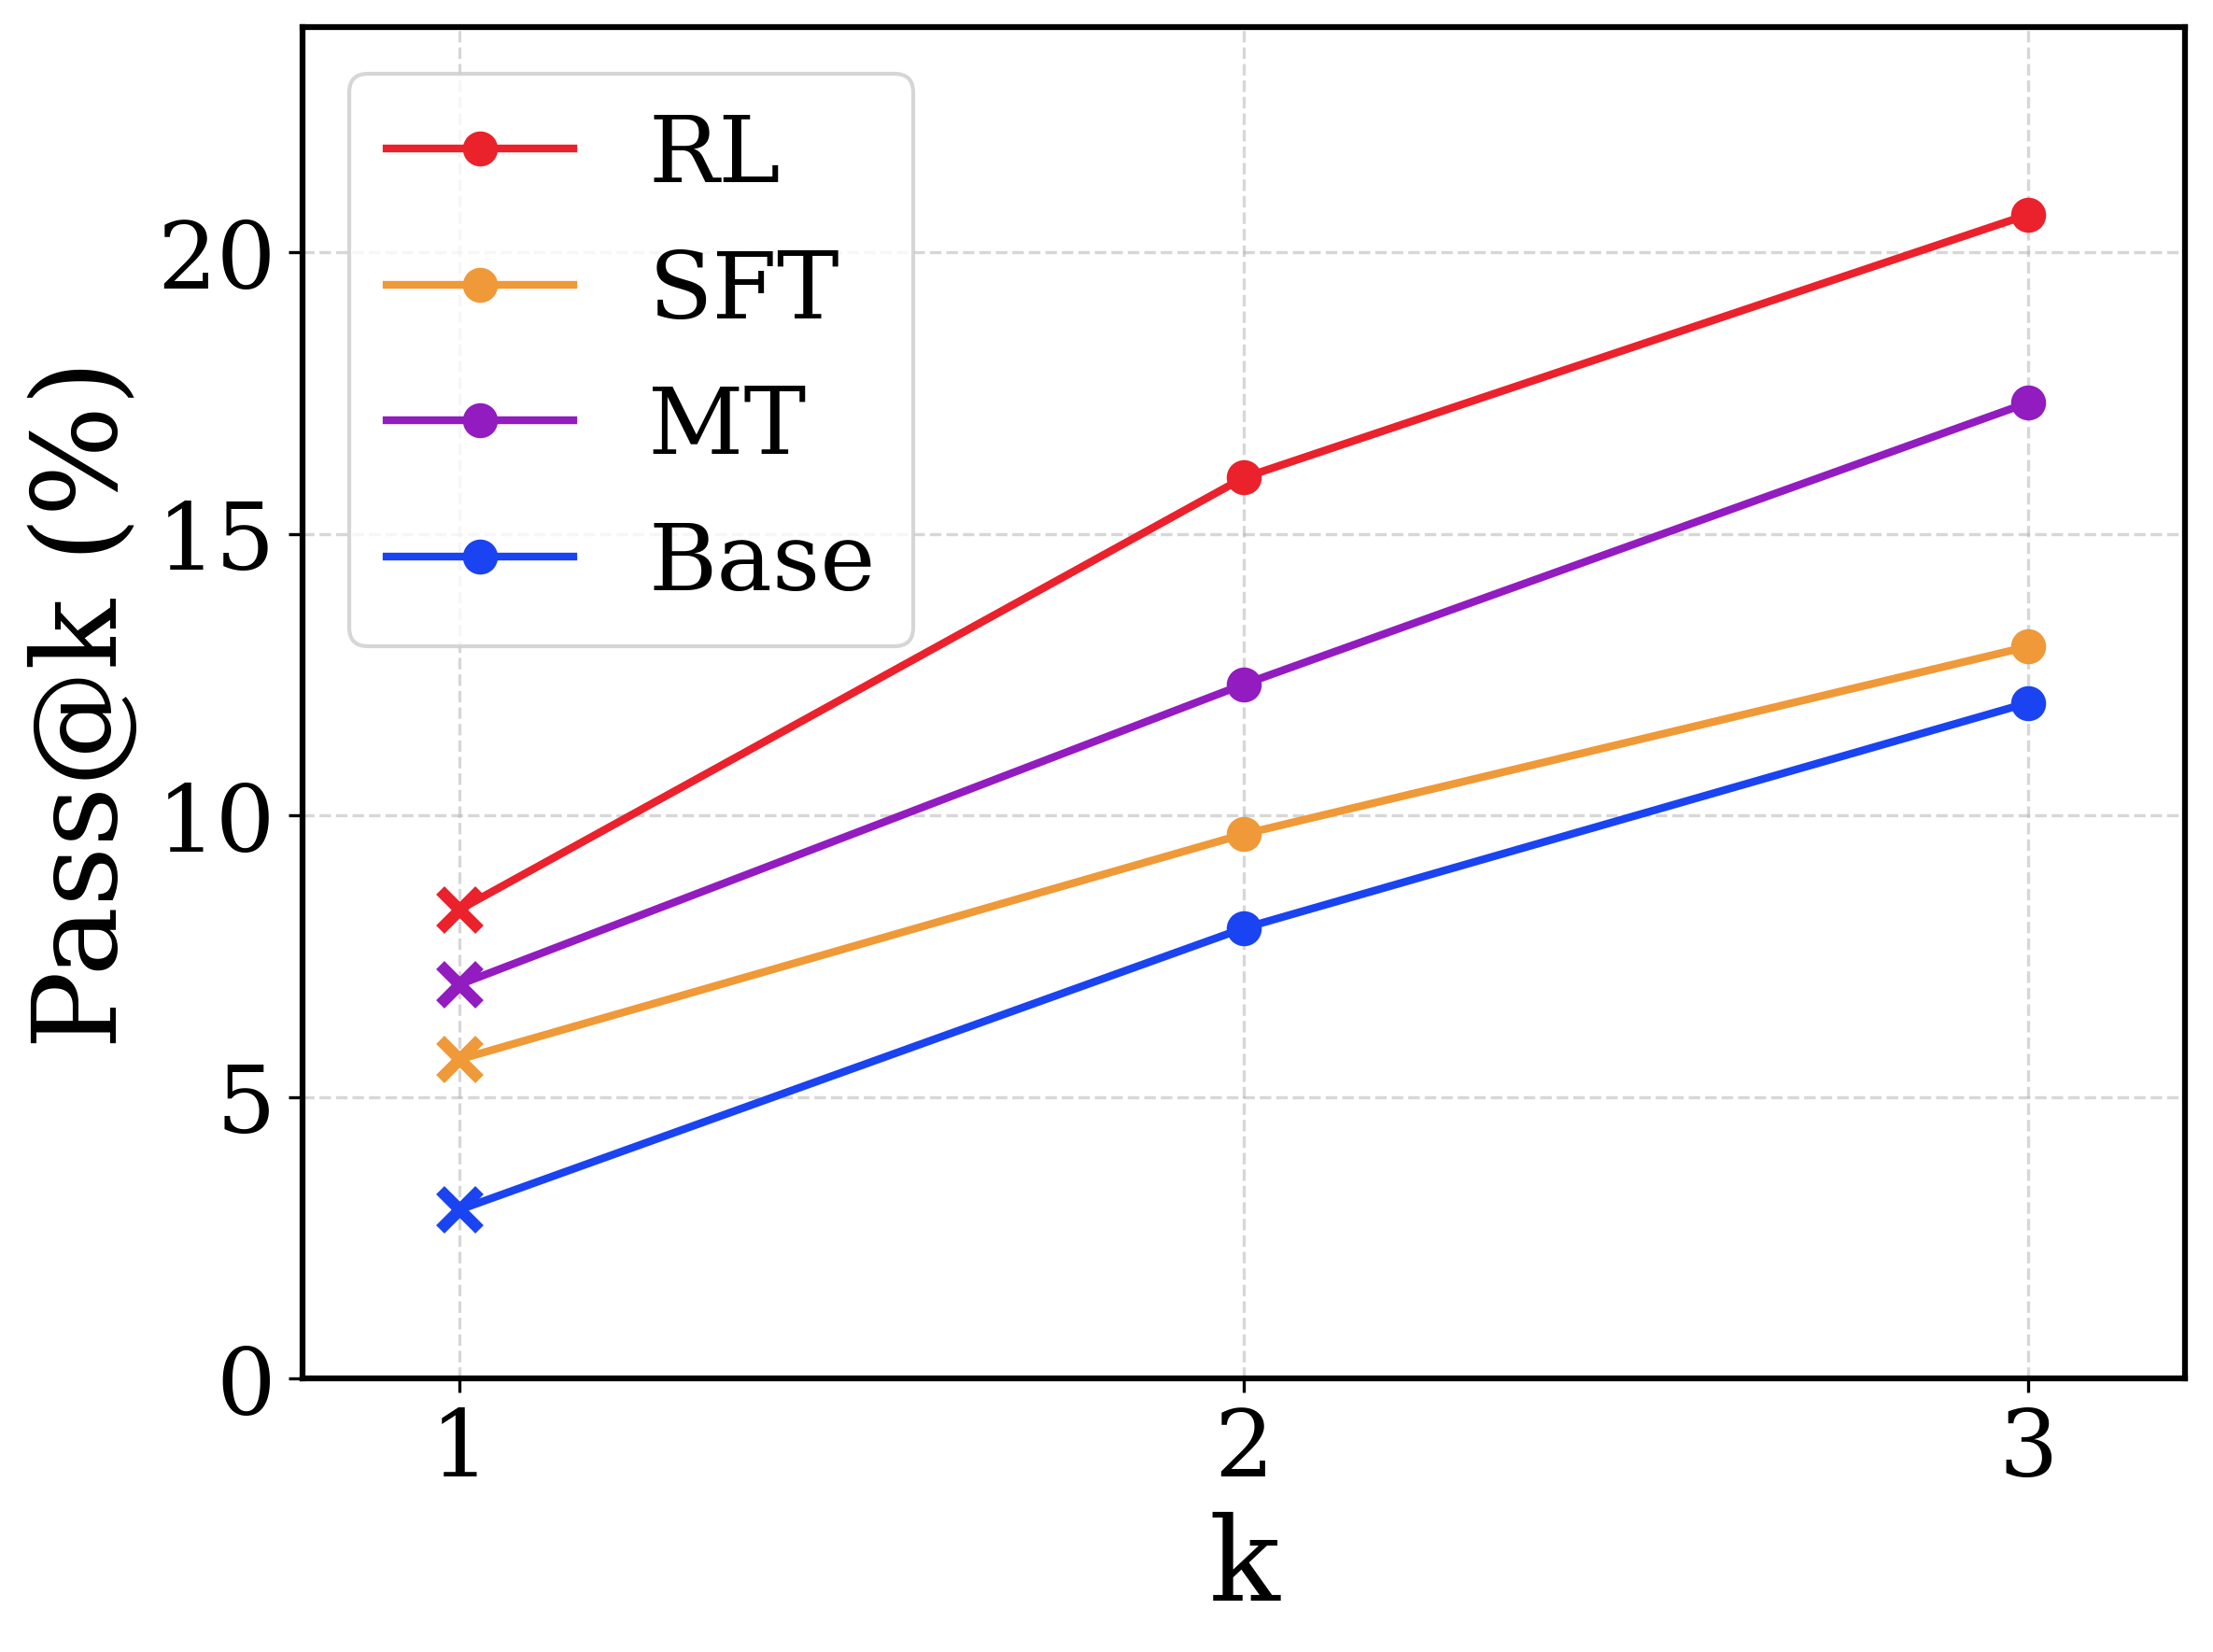
The image depicts a line chart titled **"Pass@k (%)"** with the following components:
### Axes
- **X-axis (Horizontal):** Labeled `k` with discrete values at `1`, `2`, and `3`.
- **Y-axis (Vertical):** Labeled `Pass@k (%)` with a range from `0` to `20` in increments of `5`.
### Legend
- Located in the **top-left corner** of the chart.
- **Color-Coded Labels:**
- `RL` (Red)
- `SFT` (Orange)
- `MT` (Purple)
- `Base` (Blue)
### Data Series
#### 1. RL (Red Line)
- **Trend:** Steep upward slope.
- **Data Points:**
- `k=1`: `8%`
- `k=2`: `16%`
- `k=3`: `20.5%`
#### 2. SFT (Orange Line)
- **Trend:** Moderate upward slope.
- **Data Points:**
- `k=1`: `5.5%`
- `k=2`: `9.5%`
- `k=3`: `13%`
#### 3. MT (Purple Line)
- **Trend:** Steeper than SFT but less than RL.
- **Data Points:**
- `k=1`: `7%`
- `k=2`: `12.5%`
- `k=3`: `17.5%`
#### 4. Base (Blue Line)
- **Trend:** Gentle upward slope.
- **Data Points:**
- `k=1`: `3%`
- `k=2`: `8%`
- `k=3`: `12%`
### Key Observations
- All lines show **increasing trends** as `k` increases.
- `RL` consistently outperforms other methods across all `k` values.
- `Base` has the lowest performance, while `RL` achieves the highest Pass@k percentage.
### Spatial Grounding
- **Legend Position:** Top-left corner (coordinates: `[x=0, y=0]` relative to chart boundaries).
- **Data Point Colors:** Match legend labels exactly (e.g., red for `RL`, orange for `SFT`).
### Trend Verification
- **RL:** Sharpest increase (e.g., `8%` → `20.5%` over `k=1` to `k=3`).
- **MT:** Second-steepest increase (e.g., `7%` → `17.5%`).
- **SFT/Base:** Gradual increases (e.g., `5.5%` → `13%` for SFT; `3%` → `12%` for Base).
### Component Isolation
1. **Header:** Chart title (`Pass@k (%)`) and axis labels.
2. **Main Chart:** Four distinct lines with markers and slopes.
3. **Footer:** No additional text or annotations.
### Final Notes
- No non-English text or embedded diagrams present.
- All numerical values and labels extracted directly from the chart.