## Bar Chart: Hits@1 Comparison of GoG and Graph-RFT
### Overview
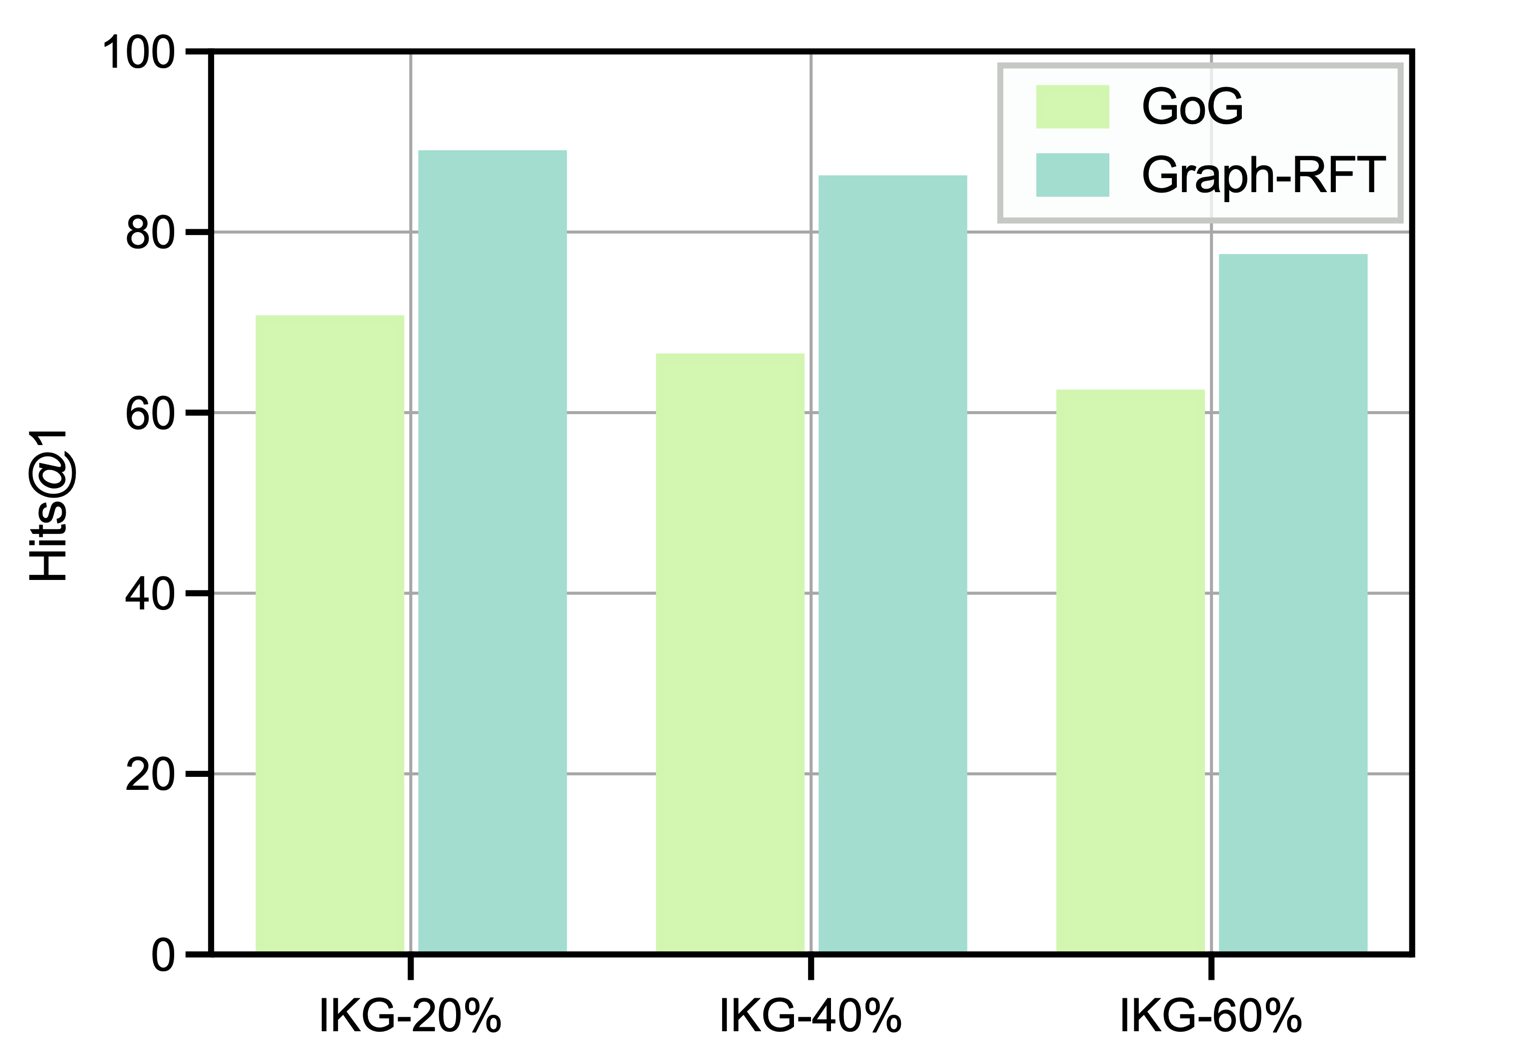
The image is a bar chart comparing the "Hits@1" metric for two methods, "GoG" and "Graph-RFT", across three different IKG (Incomplete Knowledge Graph) settings: IKG-20%, IKG-40%, and IKG-60%. The chart visually represents the performance of each method under varying degrees of knowledge incompleteness.
### Components/Axes
* **Y-axis:** "Hits@1" ranging from 0 to 100, with tick marks at intervals of 20.
* **X-axis:** Categorical axis representing the IKG settings: IKG-20%, IKG-40%, and IKG-60%.
* **Legend:** Located in the top-right corner, indicating "GoG" in light green and "Graph-RFT" in light blue.
### Detailed Analysis
The chart presents the "Hits@1" values for "GoG" and "Graph-RFT" across three IKG settings.
* **IKG-20%:**
* GoG (light green): Approximately 71
* Graph-RFT (light blue): Approximately 89
* **IKG-40%:**
* GoG (light green): Approximately 66
* Graph-RFT (light blue): Approximately 87
* **IKG-60%:**
* GoG (light green): Approximately 63
* Graph-RFT (light blue): Approximately 78
### Key Observations
* Graph-RFT consistently outperforms GoG across all IKG settings.
* Both GoG and Graph-RFT show a decrease in "Hits@1" as the IKG percentage increases from 20% to 60%.
### Interpretation
The data suggests that Graph-RFT is more robust to incomplete knowledge graphs than GoG, as it consistently achieves higher "Hits@1" scores. The decrease in performance for both methods as the IKG percentage increases indicates that both are affected by the incompleteness of the knowledge graph, but Graph-RFT is less affected. The "Hits@1" metric likely represents the accuracy or recall of a prediction task, so higher values indicate better performance.