## Grouped Bar Chart: Performance Comparison of GoG and Graph-RFT Across IKG Levels
### Overview
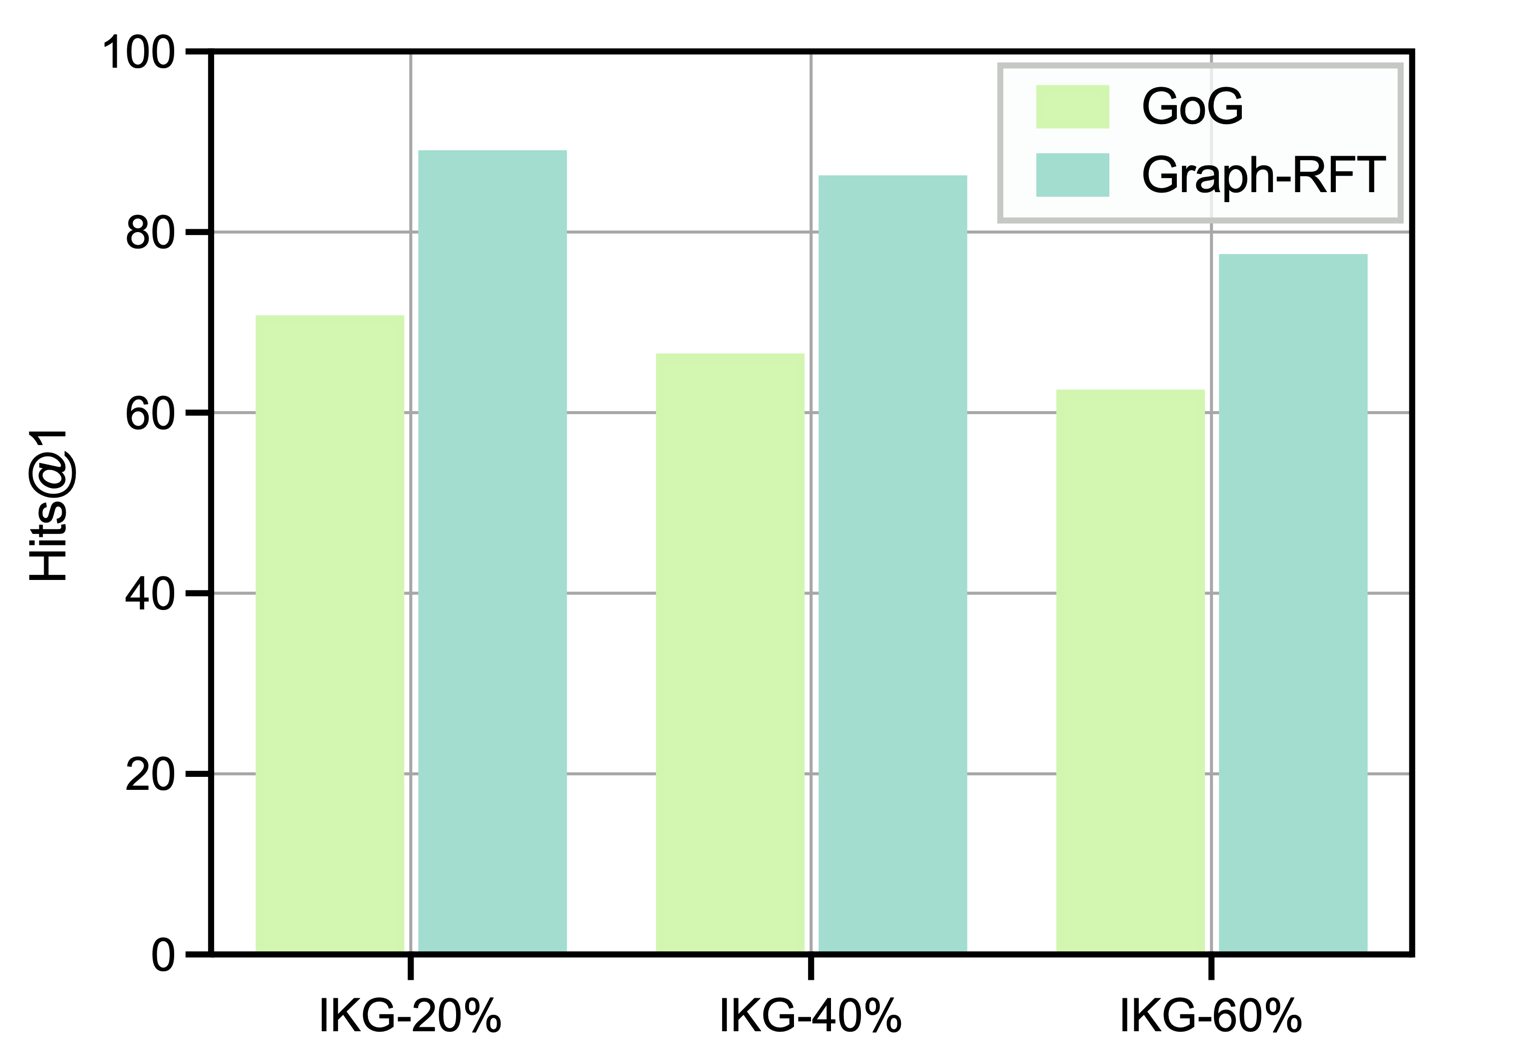
This image is a grouped bar chart comparing the performance of two methods, labeled "GoG" and "Graph-RFT," across three different conditions or datasets. The performance metric is "Hits@1," plotted on the y-axis. The chart visually demonstrates that Graph-RFT consistently outperforms GoG across all tested conditions.
### Components/Axes
* **Chart Type:** Grouped Bar Chart.
* **Y-Axis:**
* **Label:** "Hits@1" (likely a performance metric, such as accuracy where the correct answer is ranked first).
* **Scale:** Linear scale from 0 to 100, with major grid lines at intervals of 20 (0, 20, 40, 60, 80, 100).
* **X-Axis:**
* **Categories:** Three distinct categories, labeled:
1. `IKG-20%`
2. `IKG-40%`
3. `IKG-60%`
* These labels likely represent different experimental settings, possibly varying levels of a parameter called "IKG."
* **Legend:**
* **Position:** Top-right corner of the chart area.
* **Entries:**
1. **GoG:** Represented by a light green (pale yellow-green) bar.
2. **Graph-RFT:** Represented by a teal (blue-green) bar.
* **Data Series:** Two series of bars, one for each method, grouped together for each x-axis category.
### Detailed Analysis
The chart presents the following approximate "Hits@1" values for each method and category. Values are estimated based on the bar heights relative to the y-axis grid lines.
**Trend Verification:**
* **GoG (Light Green Bars):** The visual trend shows a slight, consistent decrease in performance as the IKG percentage increases from 20% to 60%.
* **Graph-RFT (Teal Bars):** The visual trend also shows a decrease in performance as IKG percentage increases, but the decline appears more pronounced between IKG-40% and IKG-60%.
**Data Points (Approximate Values):**
| Category | GoG (Hits@1) | Graph-RFT (Hits@1) | Performance Gap (Graph-RFT - GoG) |
| :--------- | :----------- | :------------------ | :-------------------------------- |
| **IKG-20%** | ~70 | ~90 | ~+20 |
| **IKG-40%** | ~66 | ~86 | ~+20 |
| **IKG-60%** | ~62 | ~78 | ~+16 |
### Key Observations
1. **Consistent Superiority:** Graph-RFT achieves a higher "Hits@1" score than GoG in all three categories (IKG-20%, IKG-40%, IKG-60%).
2. **Performance Degradation:** Both methods show a downward trend in performance as the IKG percentage increases. The drop is more significant for Graph-RFT between the 40% and 60% conditions.
3. **Narrowing Gap:** While Graph-RFT maintains a clear lead, the absolute performance gap between the two methods narrows slightly at the highest IKG level (IKG-60%).
4. **High Baseline Performance:** Both methods start with relatively high performance (above 60) at the IKG-20% condition.
### Interpretation
The data suggests that the **Graph-RFT method is more robust and effective** than the GoG method for the task measured by "Hits@1," regardless of the IKG setting tested. The consistent ~20-point lead at lower IKG levels indicates a significant architectural or methodological advantage.
The downward trend for both methods implies that the task becomes more challenging as the "IKG" parameter increases (from 20% to 60%). This could mean IKG represents noise, missing data, or task difficulty. Graph-RFT's steeper decline at the highest level (IKG-60%) might indicate it is more sensitive to extreme conditions, though it still outperforms GoG.
**In essence:** Graph-RFT is the superior model under these test conditions, but its advantage diminishes slightly as the problem difficulty (IKG%) increases. The chart effectively communicates a comparative performance analysis, highlighting both the relative strength of one method and the general impact of a changing experimental variable.