## Simulation: Ant Colony Optimization
### Overview
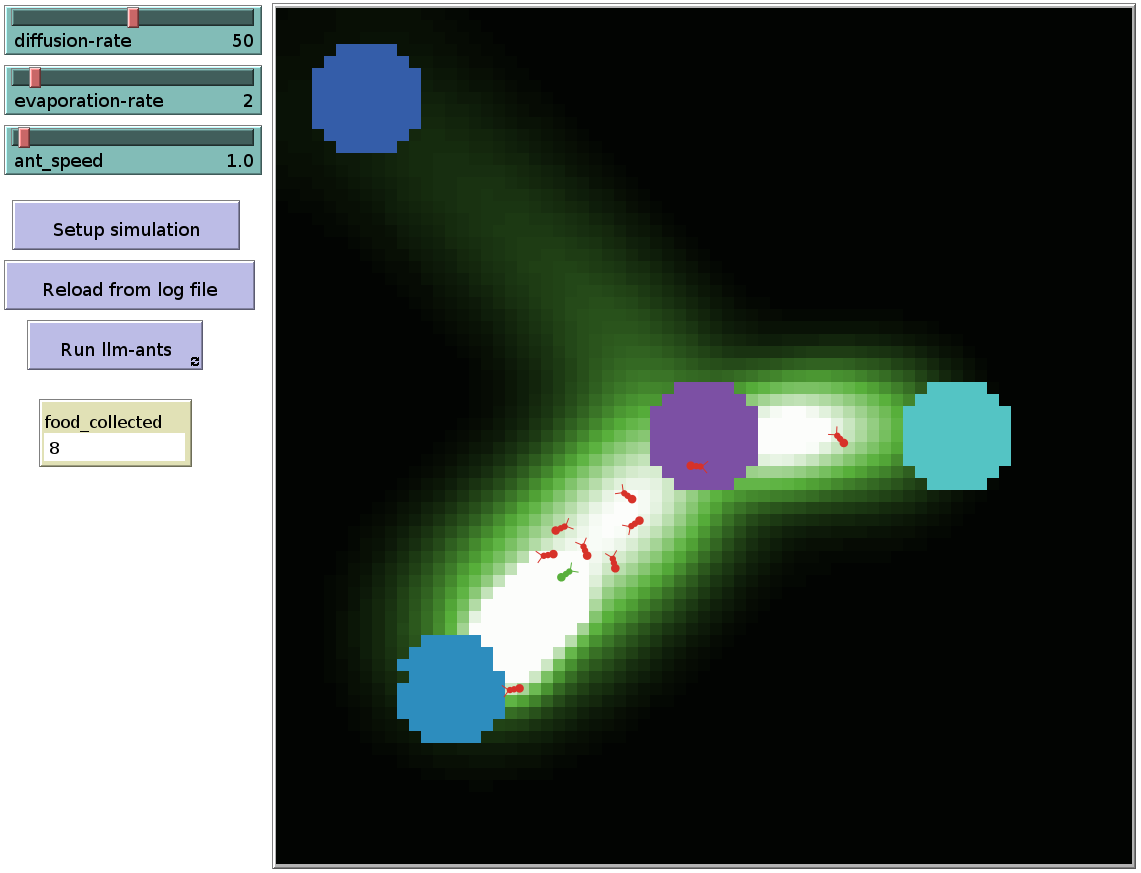
The image depicts a simulation environment, likely for demonstrating ant colony optimization. It shows a foraging area with ants moving between food sources, guided by pheromone trails. The simulation parameters are adjustable via controls on the left.
### Components/Axes
* **Simulation Area:** The main area shows a dark background with varying shades of green, representing pheromone concentrations. Brighter green indicates higher pheromone levels.
* **Food Sources:** There are four distinct food sources represented by colored circles: blue (top-left), purple (center), cyan (right), and blue (bottom-left).
* **Ants:** Several small ant icons are visible, primarily red, with one green ant. They appear to be moving along the pheromone trails.
* **Controls (Left Side):**
* `diffusion-rate`: Slider set to 50.
* `evaporation-rate`: Slider set to 2.
* `ant_speed`: Value set to 1.0.
* `Setup simulation`: Button to initialize the simulation.
* `Reload from log file`: Button to load simulation data from a log file.
* `Run Ilm-ants`: Button to start the ant colony optimization algorithm.
* `food_collected`: Display showing the value 8.
### Detailed Analysis
* **Pheromone Trails:** The ants are following a path of brighter green, indicating a pheromone trail. The trail connects the bottom-left blue food source to the purple and cyan food sources. A fainter trail extends towards the top-left blue food source.
* **Ant Movement:** The ants are clustered along the main pheromone trail, suggesting they are actively foraging and reinforcing the trail.
* **Food Collection:** The `food_collected` counter shows a value of 8, indicating that the ants have successfully collected 8 units of food.
* **Simulation Parameters:**
* `diffusion-rate` is set to 50, which controls how quickly pheromones spread.
* `evaporation-rate` is set to 2, which controls how quickly pheromones dissipate.
* `ant_speed` is set to 1.0, which controls the speed of the ants.
### Key Observations
* The ants are primarily following the strongest pheromone trail, which connects the bottom-left blue food source to the purple and cyan food sources.
* The `food_collected` counter is relatively low, suggesting the simulation is still in its early stages.
* The simulation parameters are set to specific values, which likely influence the behavior of the ants and the formation of pheromone trails.
### Interpretation
The image demonstrates a basic ant colony optimization simulation. The ants are exploring the environment, depositing pheromones, and following the trails laid down by other ants. The simulation parameters control the behavior of the ants and the dynamics of the pheromone trails. The goal of the simulation is likely to find the shortest or most efficient path between the food sources. The `food_collected` counter provides a measure of the simulation's performance. The presence of a "Reload from log file" button suggests the ability to analyze and replay previous simulation runs. The single green ant is an anomaly, and its purpose is unclear without further context.