\n
## Simulation Screenshot: Ant Colony Optimization Visualization
### Overview
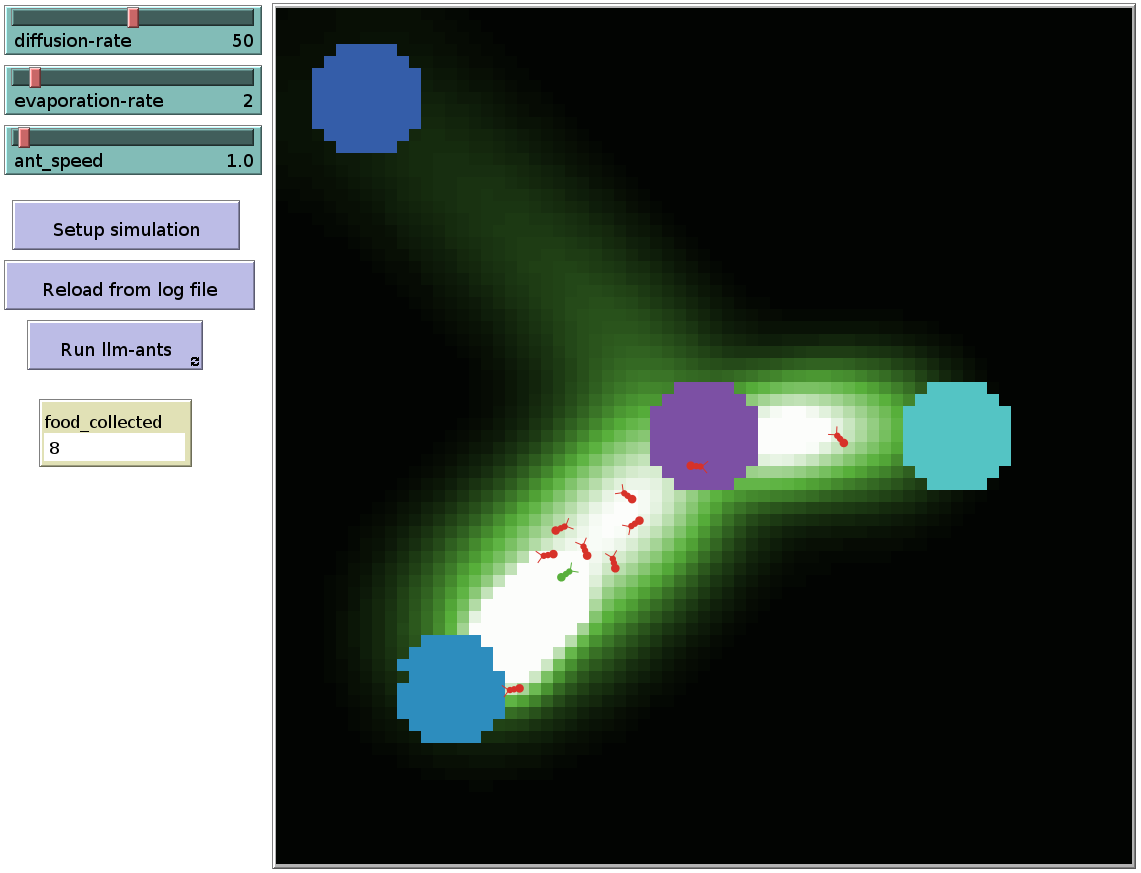
The image is a screenshot of a simulation environment, likely demonstrating an ant colony optimization algorithm. It visualizes the foraging behavior of ants between two food sources, with adjustable parameters displayed on the left side of the screen. The simulation appears to be rendered in a pixelated, 2D style.
### Components/Axes
The left side of the image contains a control panel with the following adjustable parameters:
* **diffusion-rate:** Value is approximately 50.
* **evaporation-rate:** Value is approximately 2.
* **ant_speed:** Value is approximately 1.0.
* **Buttons:** "Setup simulation", "Reload from log file", "Run 11m-ants".
* **food_collected:** Value is approximately 8.
The main area of the image displays the simulation itself. It shows two large, circular objects (likely representing food sources) connected by a trail of ants. The trail is brighter in the center and fades towards the food sources. The background is a gradient from dark at the edges to green in the center.
### Detailed Analysis or Content Details
The simulation shows a path of ants moving between two food sources. The ants are represented by small, red pixelated shapes. The path they follow is highlighted by a brighter, elongated area.
* **Food Sources:** Two large, light-blue circular objects are positioned on either side of the ant trail. They appear to be the source and destination of the ants.
* **Ant Trail:** A bright, elongated area connects the two food sources. The intensity of the trail appears to be highest in the center and diminishes towards the food sources. This likely represents the pheromone concentration laid down by the ants.
* **Ants:** Approximately 10-15 red, pixelated ants are visible along the trail. They are clustered more densely in the center of the trail.
* **Parameter Values:**
* diffusion-rate = 50
* evaporation-rate = 2
* ant_speed = 1.0
* food_collected = 8
### Key Observations
* The ants are following a defined path between the two food sources.
* The brightness of the trail suggests a higher pheromone concentration in the center.
* The simulation parameters (diffusion rate, evaporation rate, ant speed) likely influence the behavior of the ants and the formation of the trail.
* The "food_collected" value indicates the amount of food gathered by the ants during the simulation.
### Interpretation
This simulation demonstrates the core principles of ant colony optimization. Ants deposit pheromones as they travel, and other ants are more likely to follow paths with higher pheromone concentrations. This positive feedback loop leads to the emergence of an optimal path between the food sources.
The adjustable parameters allow for experimentation with different aspects of the algorithm:
* **diffusion-rate:** Controls how quickly pheromones spread. A higher rate will lead to a more diffuse trail.
* **evaporation-rate:** Controls how quickly pheromones evaporate. A higher rate will lead to a shorter-lived trail.
* **ant_speed:** Controls the speed at which the ants move.
The "food_collected" value provides a measure of the algorithm's performance. The goal of the algorithm is to maximize the amount of food collected by the ants.
The pixelated rendering suggests that this is a simplified model, focusing on the core principles of the algorithm rather than a realistic simulation of ant behavior. The gradient background is likely a visual aid to highlight the ant trail. The simulation is in progress, as indicated by the ants actively moving along the trail.