\n
## Simulation Interface: Ant Colony Optimization Model
### Overview
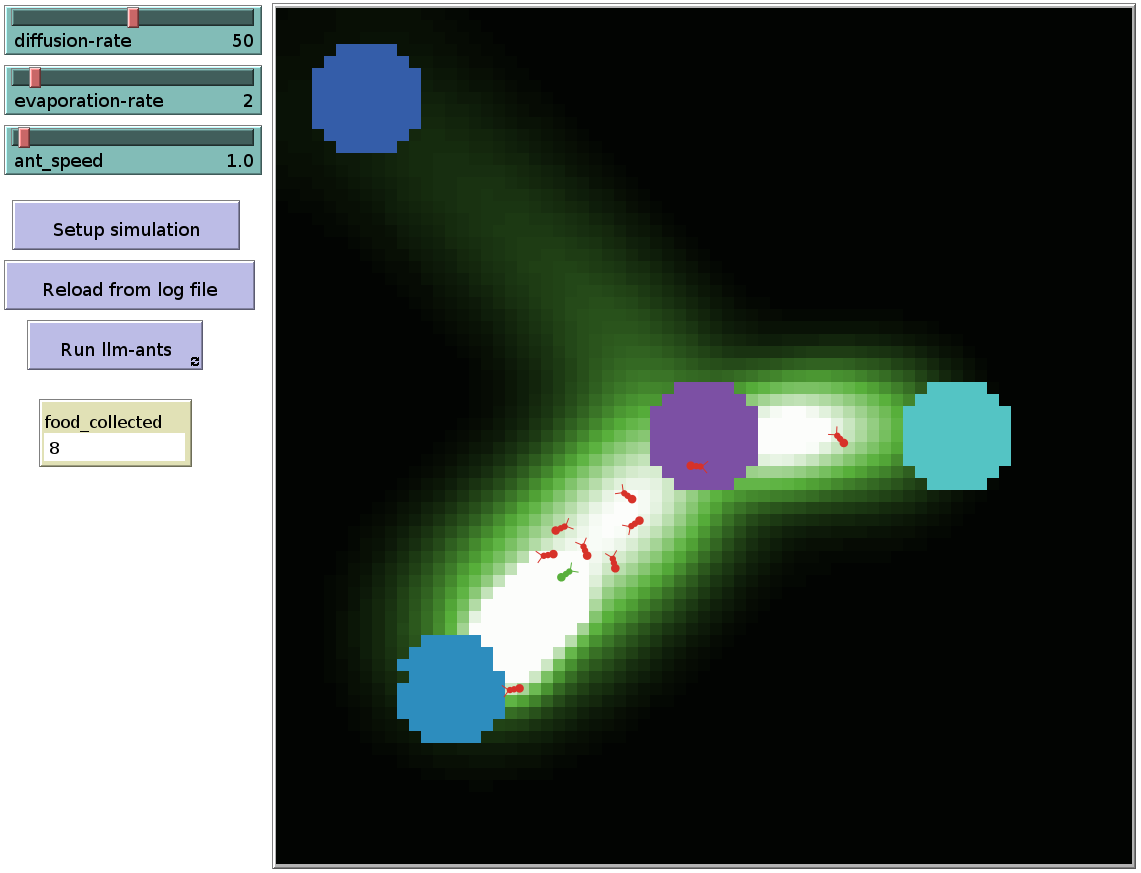
This image is a screenshot of a graphical user interface for an ant colony simulation, likely an agent-based model or optimization algorithm. The interface is divided into two main sections: a control panel on the left and a simulation visualization area on the right. The simulation appears to model ant foraging behavior, with adjustable parameters and a visual representation of agents (ants), pheromone trails, and key locations.
### Components/Axes
**Left Control Panel:**
- **Sliders & Parameters:**
- `diffusion-rate`: Slider set to value **50**.
- `evaporation-rate`: Slider set to value **2**.
- `ant_speed`: Slider set to value **1.0**.
- **Action Buttons:**
- `Setup simulation`
- `Reload from log file`
- `Run llm-ants` (with a small icon, possibly indicating a dropdown or settings).
- **Data Display:**
- A box labeled `food_collected` with the current value **8**.
**Right Simulation Area:**
- **Background:** Black.
- **Key Elements (Spatially Grounded):**
- **Top-Left:** A large, blue, octagonal shape.
- **Center:** A large, purple, octagonal shape.
- **Right:** A large, cyan (light blue), octagonal shape.
- **Bottom-Left:** A large, blue, circular shape.
- **Pheromone Trail:** A diffuse, greenish glow emanating from the center, brightest along a path connecting the bottom-left circle to the center octagon and extending towards the right octagon. The glow intensity suggests pheromone concentration.
- **Agents (Ants):** Multiple small, red, ant-like figures are visible. They are primarily clustered along the brightest part of the pheromone trail, moving between the bottom-left circle and the center octagon. One distinct **green ant** is present among the red ants near the bottom-left of the main cluster.
### Detailed Analysis
- **Agent Distribution & Movement:** The red ants are not randomly scattered. They form a clear, dense trail along the high-concentration pheromone path (bright white/green area). This indicates a coordinated foraging route. The single green ant's position within the group suggests it may have a different role (e.g., a scout, a leader, or an agent with different properties).
- **Pheromone Field:** The green glow is not uniform. It is most intense (appearing white) along the primary path between the bottom-left circle and the center octagon. It diffuses outward with decreasing intensity, consistent with a diffusion-evaporation model controlled by the left-panel parameters.
- **Spatial Relationships:** The simulation suggests a network where the colored shapes are key nodes. The current ant activity strongly links the **bottom-left blue circle** and the **center purple octagon**. A secondary, less intense trail connects the center octagon to the **right cyan octagon**. The **top-left blue octagon** appears isolated from the current pheromone trail and ant activity.
### Key Observations
1. **Parameter-Driven Simulation:** The interface explicitly links the visual output (pheromone spread, ant speed) to the numerical parameters (`diffusion-rate`, `evaporation-rate`, `ant_speed`).
2. **Emergent Path Formation:** The ants have collectively established an efficient path, visualized by the pheromone gradient. This is a classic demonstration of stigmergy—indirect coordination through environmental modification.
3. **Anomaly/Point of Interest:** The presence of a single green ant among the red ones is a deliberate feature. It could represent a different agent type, a highlighted agent for tracking, or an agent with modified behavior (e.g., following a different algorithm, as hinted by the "llm-ants" button).
4. **Quantifiable Output:** The `food_collected: 8` metric provides a direct measure of the simulation's success or progress.
### Interpretation
This image captures a moment in a computational experiment simulating ant colony optimization (ACO) or swarm intelligence. The data suggests the following:
- **The system is functional and has reached a stable state of organized foraging.** The strong pheromone trail and clustered ants indicate successful path optimization between two nodes (the blue circle and purple octagon).
- **The adjustable parameters are central to the experiment.** `Diffusion-rate` and `evaporation-rate` control how quickly pheromone signals spread and fade, directly impacting the colony's ability to discover and reinforce efficient paths. `Ant_speed` affects the temporal dynamics of the simulation.
- **The "llm-ants" button is a critical clue.** It implies this may be a novel integration where Large Language Models (LLMs) are used to govern ant behavior or decision-making, moving beyond traditional ACO algorithms. The green ant could be an agent whose actions are being directly influenced or generated by an LLM.
- **The isolated top-left node** may represent a future target, an obstacle, or a control in the experiment. Its lack of pheromone connection shows the colony has not yet discovered or prioritized a path to it.
In essence, this is not just a game or animation; it's a technical tool for studying emergent behavior, testing optimization algorithms, and potentially exploring the intersection of swarm intelligence and large language models. The visual output provides immediate, intuitive feedback on how parameter changes affect collective agent behavior.