## Simulation Interface: Ant Foraging Behavior Model
### Overview
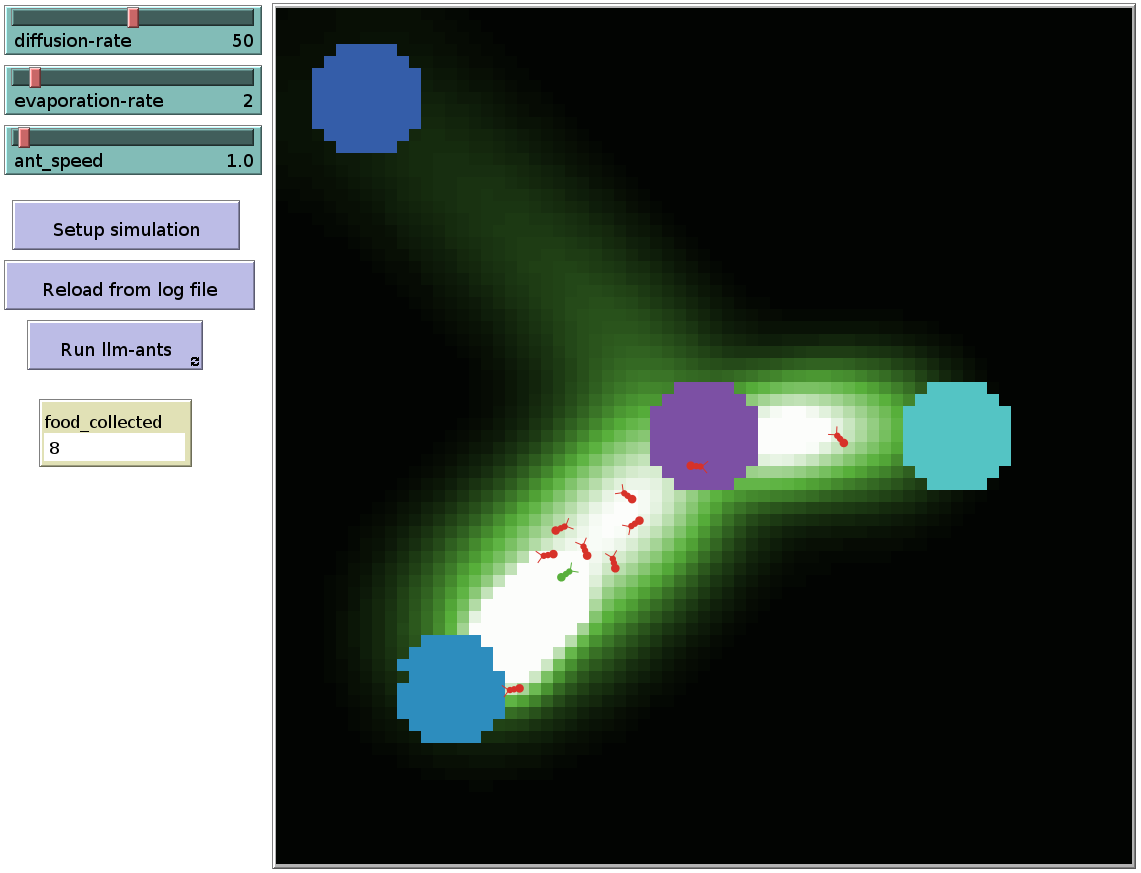
The image depicts a computational simulation interface modeling ant foraging behavior. The main visualization area shows a grid with colored circular regions and moving red ant icons. Control parameters and status indicators are displayed on the left panel.
### Components/Axes
**Left Control Panel:**
1. **Sliders:**
- `diffusion-rate`: 50 (dark gray bar with red indicator)
- `evaporation-rate`: 2 (dark gray bar with red indicator)
- `ant_speed`: 1.0 (dark gray bar with red indicator)
2. **Buttons:**
- `Setup simulation` (light purple)
- `Reload from log file` (light purple)
- `Run llm-ants` (light purple)
3. **Status Display:**
- `food_collected`: 8 (light green background)
**Main Visualization Area:**
- Grid-based environment with:
- **Cyan circle** (top-left quadrant)
- **Purple circle** (center-right)
- **Cyan circle** (bottom-right quadrant)
- Gradient heatmap showing intensity from cyan (brightest) to purple (darkest)
- Red ant icons moving along gradient paths
### Detailed Analysis
**Parameter Values:**
- Diffusion rate: 50 (high value suggests rapid pheromone spread)
- Evaporation rate: 2 (low value indicates slow pheromone dissipation)
- Ant speed: 1.0 (moderate movement rate)
- Food collected: 8 units (current simulation output)
**Visual Elements:**
1. **Gradient Path:**
- Brightest intensity at cyan circle (top-left)
- Fades through green/yellow to purple circle (center-right)
- Secondary gradient from cyan circle (bottom-right) to purple
2. **Ant Movement:**
- 7 red ant icons visible
- Movement pattern follows gradient paths
- Concentration near purple circle suggests food source
3. **Circular Regions:**
- Cyan circles (2 instances) likely represent food sources
- Purple circle (1 instance) likely represents nest/home base
### Key Observations
1. Ants preferentially move toward purple circle despite multiple food sources
2. Gradient intensity correlates with ant path density
3. High diffusion rate (50) creates broad gradient spread
4. Low evaporation rate (2) maintains gradient persistence
5. Ant speed (1.0) balances exploration/exploitation
### Interpretation
This simulation demonstrates emergent behavior in ant colony optimization algorithms. The parameters suggest:
- **Pheromone Dynamics:** High diffusion ensures widespread trail information, while low evaporation maintains trail persistence for effective foraging.
- **Foraging Strategy:** Ants follow gradient intensity (likely representing pheromone concentration or food quality), demonstrating stigmergic communication.
- **Resource Allocation:** The 8 food units collected indicate successful pathfinding despite multiple food sources.
- **Algorithmic Efficiency:** The system balances exploration (multiple paths) and exploitation (convergence to optimal path) through parameter tuning.
The interface provides real-time feedback through the food counter and visual gradient, allowing users to experiment with parameter adjustments to optimize foraging efficiency. The gradient visualization serves as both a data representation and a control mechanism, creating an interactive learning environment for swarm intelligence concepts.