## Line Graph: Model Accuracy vs. Compute (exaFLOP)
### Overview
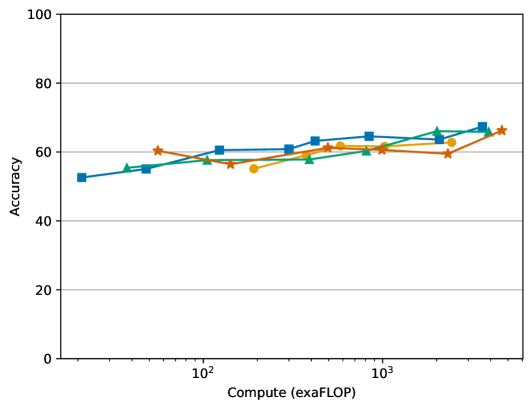
The image is a line graph comparing the accuracy of four machine learning models (A, B, C, D) across varying computational resources (exaFLOP). The y-axis represents accuracy (0–100%), and the x-axis represents compute power on a logarithmic scale (10² to 10³ exaFLOP). Four distinct data series are plotted with unique markers and colors.
### Components/Axes
- **Y-Axis**: "Accuracy" (0–100%, linear scale)
- **X-Axis**: "Compute (exaFLOP)" (logarithmic scale: 10², 10².5, 10³)
- **Legend**: Located on the right, associating:
- Blue squares: Model A
- Green triangles: Model B
- Orange circles: Model C
- Red stars: Model D
### Detailed Analysis
1. **Model A (Blue Squares)**:
- Starts at ~50% accuracy at 10² exaFLOP.
- Gradually increases to ~60% at 10³ exaFLOP.
- Trend: Steady upward slope with minimal fluctuation.
2. **Model B (Green Triangles)**:
- Begins at ~55% at 10² exaFLOP.
- Dips slightly to ~58% at 10².5 exaFLOP.
- Rises to ~62% at 10³ exaFLOP.
- Trend: Initial dip followed by consistent growth.
3. **Model C (Orange Circles)**:
- Starts at ~52% at 10² exaFLOP.
- Peaks at ~61% at 10².5 exaFLOP.
- Slightly declines to ~60% at 10³ exaFLOP.
- Trend: Early rapid improvement, then plateau.
4. **Model D (Red Stars)**:
- Begins at ~60% at 10² exaFLOP.
- Drops to ~58% at 10².5 exaFLOP.
- Sharp rise to ~65% at 10³ exaFLOP.
- Trend: Initial decline followed by steep recovery.
### Key Observations
- **Model D (Red Stars)** demonstrates the most dramatic improvement, gaining ~7% accuracy between 10².5 and 10³ exaFLOP.
- **Model C (Orange Circles)** shows diminishing returns after 10².5 exaFLOP.
- **Model B (Green Triangles)** exhibits a potential "learning curve" dip before stabilizing.
- All models converge near ~60–65% accuracy at 10³ exaFLOP, suggesting diminishing marginal gains at higher compute levels.
### Interpretation
The data suggests that computational power correlates with accuracy, but efficiency varies significantly across models. Model D (red stars) achieves the highest performance at scale, implying superior optimization for large-scale compute. Model C’s plateau indicates potential architectural limitations despite early gains. The dip in Model B’s performance at mid-range compute may reflect training instability or resource bottlenecks. Notably, no model exceeds ~65% accuracy even at 10³ exaFLOP, highlighting a possible ceiling effect or dataset constraints. The logarithmic x-axis emphasizes that compute improvements beyond 10³ exaFLOP would yield progressively smaller accuracy gains, per the observed trends.