TECHNICAL ASSET FINGERPRINT
d51b54b9d585b28f2d94585f
Click to view fullscreen
Press ESC or click to close
FOUND IN PAPERS
EXPERT: healer-alpha-free VERSION 1
RUNTIME: free/openrouter/healer-alpha
INTEL_VERIFIED
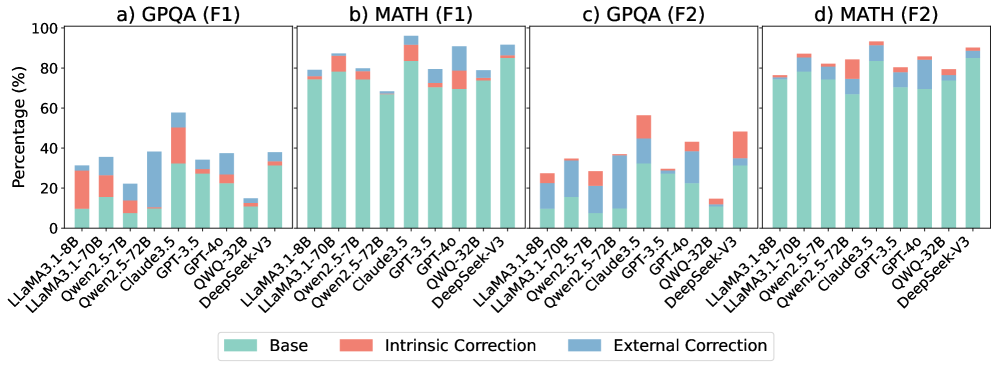
## [Multi-Panel Bar Chart]: AI Model Performance Comparison on GPQA and MATH Tasks
### Overview
The image displays a set of four stacked bar charts comparing the performance of various large language models (LLMs) on two different tasks (GPQA and MATH) using two different evaluation metrics (F1 and F2). The performance is broken down into three components: Base, Intrinsic Correction, and External Correction. The charts are arranged in a 2x2 grid, labeled a) through d).
### Components/Axes
* **Overall Structure:** Four subplots arranged horizontally.
* **Subplot Titles:**
* a) GPQA (F1)
* b) MATH (F1)
* c) GPQA (F2)
* d) MATH (F2)
* **Y-Axis (All Subplots):** Labeled "Percentage (%)". The scale runs from 0 to 100 in increments of 20.
* **X-Axis (All Subplots):** Lists the same set of 9 AI models in the same order. The labels are rotated approximately 45 degrees for readability. The models are:
1. LLaMA3.1-8B
2. LLaMA3.1-70B
3. Qwen2.5-7B
4. Qwen2.5-72B
5. Claude3.5
6. GPT-3.5
7. GPT-4o
8. QWQ-32B
9. DeepSeek-V3
* **Legend:** Positioned at the bottom center of the entire figure. It defines the three stacked components of each bar:
* **Teal/Green:** Base
* **Salmon/Red:** Intrinsic Correction
* **Blue:** External Correction
### Detailed Analysis
The following analysis provides approximate percentage values for each component of each bar. Values are estimated based on visual alignment with the y-axis grid lines.
**a) GPQA (F1)**
* **Trend:** Performance varies significantly. Claude3.5 and GPT-4o show the highest total scores. QWQ-32B has the lowest total score.
* **Data Points (Approximate):**
* LLaMA3.1-8B: Base ~15%, Intrinsic ~15%, External ~0%. Total ~30%.
* LLaMA3.1-70B: Base ~15%, Intrinsic ~10%, External ~10%. Total ~35%.
* Qwen2.5-7B: Base ~10%, Intrinsic ~5%, External ~5%. Total ~20%.
* Qwen2.5-72B: Base ~10%, Intrinsic ~5%, External ~25%. Total ~40%.
* Claude3.5: Base ~30%, Intrinsic ~20%, External ~5%. Total ~55%.
* GPT-3.5: Base ~15%, Intrinsic ~10%, External ~10%. Total ~35%.
* GPT-4o: Base ~15%, Intrinsic ~10%, External ~15%. Total ~40%.
* QWQ-32B: Base ~10%, Intrinsic ~5%, External ~0%. Total ~15%.
* DeepSeek-V3: Base ~15%, Intrinsic ~10%, External ~10%. Total ~35%.
**b) MATH (F1)**
* **Trend:** Overall scores are higher than in GPQA (F1). Claude3.5 and GPT-4o again lead. The "External Correction" component is more prominent for many models.
* **Data Points (Approximate):**
* LLaMA3.1-8B: Base ~70%, Intrinsic ~5%, External ~5%. Total ~80%.
* LLaMA3.1-70B: Base ~70%, Intrinsic ~10%, External ~5%. Total ~85%.
* Qwen2.5-7B: Base ~65%, Intrinsic ~10%, External ~5%. Total ~80%.
* Qwen2.5-72B: Base ~60%, Intrinsic ~5%, External ~5%. Total ~70%.
* Claude3.5: Base ~75%, Intrinsic ~10%, External ~10%. Total ~95%.
* GPT-3.5: Base ~65%, Intrinsic ~5%, External ~10%. Total ~80%.
* GPT-4o: Base ~65%, Intrinsic ~5%, External ~20%. Total ~90%.
* QWQ-32B: Base ~65%, Intrinsic ~10%, External ~5%. Total ~80%.
* DeepSeek-V3: Base ~75%, Intrinsic ~5%, External ~10%. Total ~90%.
**c) GPQA (F2)**
* **Trend:** Scores are generally lower than in GPQA (F1). The "External Correction" component is very significant for Qwen2.5-72B and GPT-4o.
* **Data Points (Approximate):**
* LLaMA3.1-8B: Base ~10%, Intrinsic ~10%, External ~5%. Total ~25%.
* LLaMA3.1-70B: Base ~10%, Intrinsic ~5%, External ~15%. Total ~30%.
* Qwen2.5-7B: Base ~10%, Intrinsic ~5%, External ~10%. Total ~25%.
* Qwen2.5-72B: Base ~10%, Intrinsic ~5%, External ~20%. Total ~35%.
* Claude3.5: Base ~20%, Intrinsic ~25%, External ~5%. Total ~50%.
* GPT-3.5: Base ~15%, Intrinsic ~5%, External ~10%. Total ~30%.
* GPT-4o: Base ~15%, Intrinsic ~5%, External ~20%. Total ~40%.
* QWQ-32B: Base ~10%, Intrinsic ~5%, External ~0%. Total ~15%.
* DeepSeek-V3: Base ~15%, Intrinsic ~20%, External ~10%. Total ~45%.
**d) MATH (F2)**
* **Trend:** Scores are high, similar to MATH (F1). Claude3.5 and GPT-4o are top performers. The "External Correction" component is substantial for several models.
* **Data Points (Approximate):**
* LLaMA3.1-8B: Base ~65%, Intrinsic ~5%, External ~5%. Total ~75%.
* LLaMA3.1-70B: Base ~65%, Intrinsic ~10%, External ~10%. Total ~85%.
* Qwen2.5-7B: Base ~65%, Intrinsic ~5%, External ~10%. Total ~80%.
* Qwen2.5-72B: Base ~60%, Intrinsic ~5%, External ~15%. Total ~80%.
* Claude3.5: Base ~70%, Intrinsic ~10%, External ~10%. Total ~90%.
* GPT-3.5: Base ~60%, Intrinsic ~5%, External ~15%. Total ~80%.
* GPT-4o: Base ~65%, Intrinsic ~5%, External ~15%. Total ~85%.
* QWQ-32B: Base ~65%, Intrinsic ~5%, External ~10%. Total ~80%.
* DeepSeek-V3: Base ~70%, Intrinsic ~5%, External ~15%. Total ~90%.
### Key Observations
1. **Model Hierarchy:** Claude3.5 and GPT-4o consistently achieve the highest total percentages across all four metrics. QWQ-32B consistently shows the lowest or among the lowest total scores.
2. **Task Difficulty:** Models score significantly higher on the MATH task (subplots b and d) than on the GPQA task (subplots a and c), suggesting GPQA is a more challenging benchmark for these models.
3. **Correction Impact:** The "External Correction" (blue) component is often the largest contributor to the total score for mid-performing models, especially on the GPQA task. For top models like Claude3.5, the "Base" (teal) component is dominant.
4. **Metric Difference (F1 vs. F2):** For the same task, the F2 metric generally yields lower scores than the F1 metric, particularly for the GPQA task. This indicates the F2 evaluation is stricter.
### Interpretation
This chart provides a comparative analysis of LLM capabilities on reasoning-heavy tasks (GPQA, likely a science QA benchmark, and MATH). The breakdown into Base, Intrinsic, and External Correction suggests an evaluation framework that measures not just raw model output ("Base"), but also the model's ability to self-correct ("Intrinsic") and benefit from external feedback or tools ("External").
The data demonstrates that model scale (e.g., LLaMA3.1-70B vs. 8B) and architecture (Claude, GPT, Qwen, etc.) lead to significant performance differences. The consistent lead of Claude3.5 and GPT-4o indicates their superior reasoning capabilities on these benchmarks. The high contribution of "External Correction" for many models implies that their standalone reasoning is less reliable, but they can effectively utilize additional mechanisms to improve accuracy. The stark difference between GPQA and MATH scores highlights that model performance is highly task-dependent; excelling in mathematical reasoning does not guarantee equivalent performance in scientific question answering.
DECODING INTELLIGENCE...