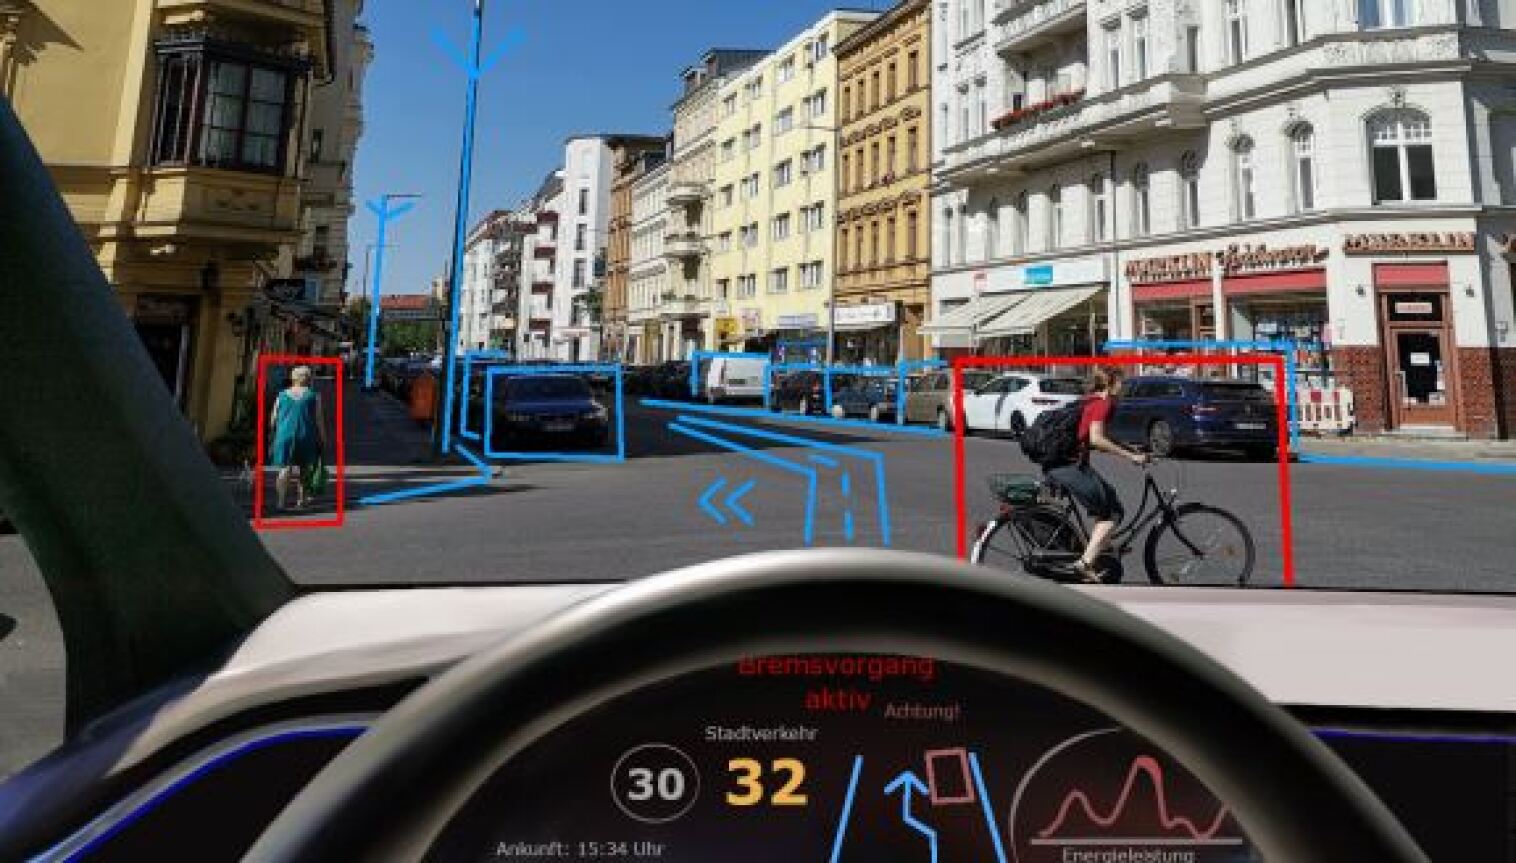
## Screenshot: Autonomous Vehicle Dashboard with Augmented Reality Street View
### Overview
This image is a first-person perspective screenshot from the driver's seat of a vehicle, likely an autonomous or advanced driver-assistance system (ADAS). It displays a real-world urban street scene overlaid with computer vision detection boxes and path planning graphics, combined with a digital instrument cluster showing vehicle status and navigation information.
### Components/Axes
The image is composed of two primary regions:
1. **Main Windshield View (Upper ~70% of frame):** Shows a European city street with multi-story buildings, parked cars, and moving traffic. Overlaid on this view are augmented reality (AR) graphics.
2. **Digital Dashboard (Lower ~30% of frame):** A curved digital display behind the steering wheel showing vehicle telemetry, alerts, and navigation.
**AR Overlay Elements (Windshield View):**
* **Bounding Boxes:** Used to classify and track objects.
* **Red Boxes:** Indicate high-priority or vulnerable road users.
* One box (center-left) surrounds a pedestrian walking on the sidewalk, wearing a blue dress.
* One box (center-right) surrounds a cyclist riding a bicycle in the lane, wearing a red shirt and a backpack.
* **Blue Boxes:** Indicate other vehicles and static infrastructure.
* Multiple boxes surround parked and moving cars along both sides of the street.
* Boxes also appear to outline building facades and streetlights.
* **Path Planning Graphics (Blue Lines):**
* A series of blue lines and arrows on the road surface indicate the vehicle's intended path or lane-keeping guidance. The lines converge toward the center of the lane ahead.
* A large blue arrow points forward and slightly left, suggesting a planned lane change or path adjustment.
**Digital Dashboard Elements:**
* **Central Speed Display:**
* A large yellow number **"32"** indicates the current vehicle speed in km/h.
* To its left, a circular icon with the number **"30"** represents the detected speed limit.
* **Text Alerts (German):**
* **"Bremsvorgang aktiv"** (in red) - Translation: "Braking process active."
* **"Achtung!"** (in red, smaller) - Translation: "Attention!" or "Warning!"
* **"Stadtverkehr"** - Translation: "City traffic." Likely indicates the current driving mode.
* **Navigation & Status:**
* **"Ankunft: 15:34 Uhr"** - Translation: "Arrival: 3:34 PM."
* A simplified map graphic showing the planned route with an upward arrow.
* A square icon, possibly representing a destination or waypoint.
* **Energy Graph (Right side):**
* A line graph labeled **"Energieleistung"** - Translation: "Energy performance" or "Power output."
* The graph shows a fluctuating red line, indicating real-time power consumption or regeneration.
### Detailed Analysis
* **Scene Context:** The environment is a dense urban setting ("Stadtverkehr") during daylight hours. The architecture suggests a Central European city.
* **System State:** The vehicle is in motion at 32 km/h, slightly above the detected 30 km/h limit. The "Bremsvorgang aktiv" alert indicates the autonomous system is currently applying the brakes, likely in response to the detected cyclist and pedestrian in close proximity.
* **Object Detection:** The system has successfully identified and classified multiple object types: pedestrians (red box), cyclists (red box), cars (blue boxes), and infrastructure (blue boxes). The use of different colored boxes implies a priority or threat-level hierarchy.
* **Path Planning:** The blue path lines show the system's calculated safe trajectory through the environment, navigating between the detected objects.
### Key Observations
1. **Active Hazard Response:** The simultaneous "Braking process active" alert and the red bounding boxes around the pedestrian and cyclist strongly suggest the system is executing a protective maneuver, likely slowing down to create a safe distance.
2. **Speed Limit Compliance:** The vehicle is traveling 2 km/h over the detected speed limit, which may be within an acceptable tolerance or could be the reason for the braking action.
3. **Comprehensive Environmental Mapping:** The blue boxes around building facades indicate the system is not only tracking dynamic objects but also mapping the static environment for localization and path planning.
4. **Energy Monitoring:** The "Energieleistung" graph provides real-time feedback on the vehicle's powertrain efficiency, which is crucial for electric or hybrid vehicles.
### Interpretation
This image provides a technical snapshot of an autonomous driving system's perception and decision-making process in a complex urban scenario. It demonstrates the system's core functions operating in unison:
* **Perception:** Identifying and classifying all relevant actors (vulnerable road users, vehicles) and the static environment.
* **Planning:** Calculating a safe path (blue lines) through the perceived environment.
* **Action & Control:** Executing a vehicle control command (braking) based on the plan and perceived hazards.
* **Human-Machine Interface (HMI):** Communicating the system's status, alerts, and intent to the human occupant via the dashboard and AR overlays.
The scene captures a critical moment of interaction between the autonomous vehicle and unpredictable urban elements. The red alerts and braking action highlight the system's primary safety function: to proactively avoid collisions with pedestrians and cyclists. The AR overlays serve a dual purpose: they are likely a visualization for system developers or a trust-building feature for passengers, making the AI's "thought process" transparent. The overall impression is of a sophisticated system navigating a routine but high-stakes driving environment, with its internal state and external awareness clearly displayed.