## Dashboard Display with Urban Scene Annotations
### Overview
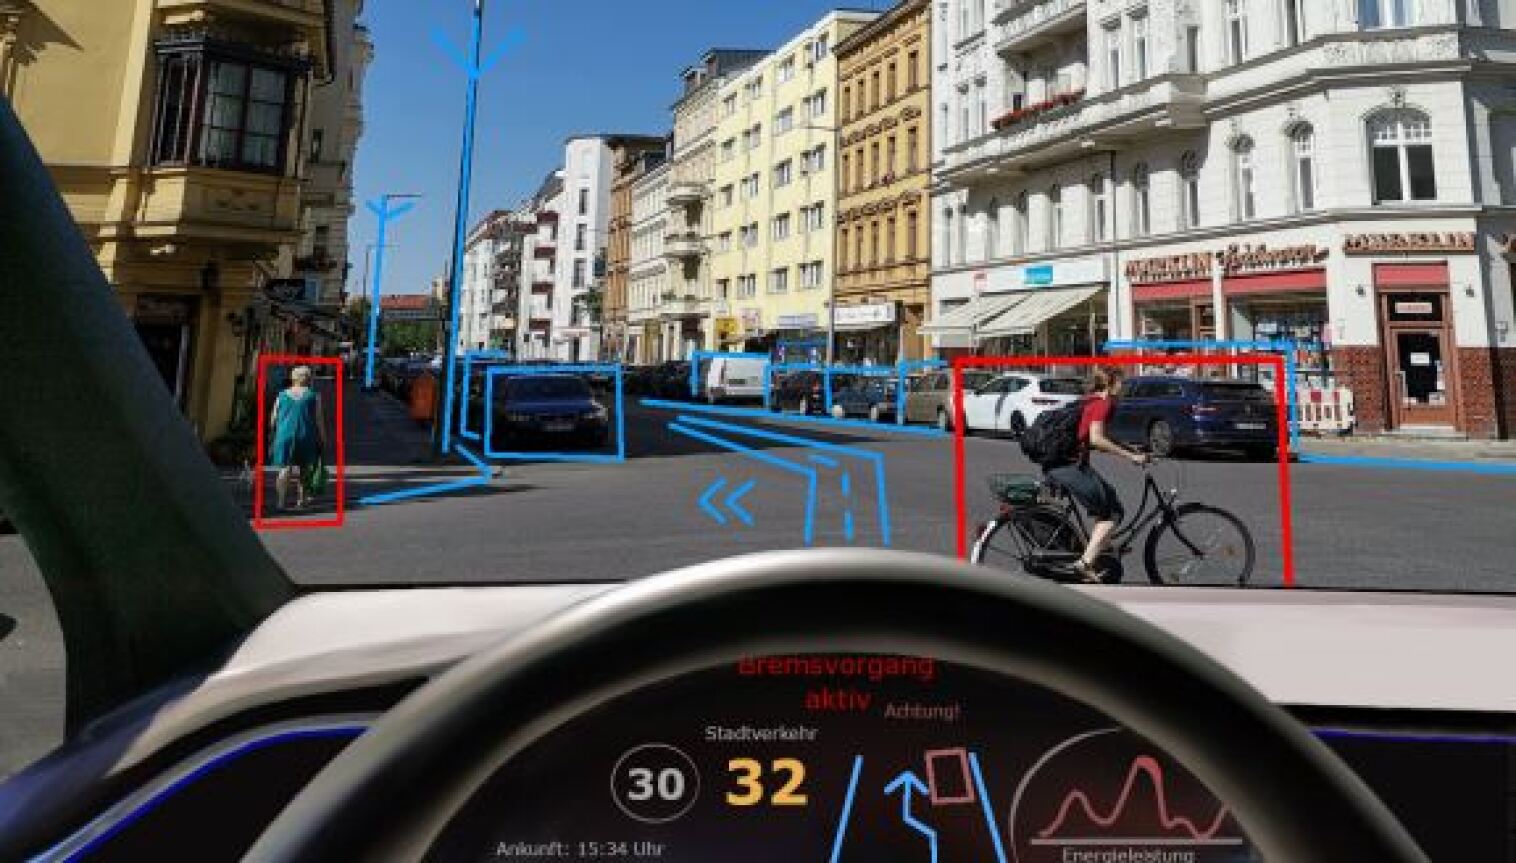
The image shows a vehicle's dashboard display with a digital interface and a view through the windshield. The dashboard includes German text, numerical data, and graphical elements. The windshield view depicts an urban street scene with annotated objects (cyclist and pedestrian) using colored bounding boxes and directional arrows.
### Components/Axes
1. **Dashboard Display**:
- **Speedometer**: Shows "30" (gray) and "32" (orange) km/h.
- **Digital Text**:
- "Stadtsverkehr" (urban traffic)
- "Bremsvorgang aktiv" (braking active)
- "Achtung!" (attention)
- "Energieleistung" (energy performance)
- **Graph**: A red wavy line labeled "Energieleistung" (energy performance).
- **Time**: "15:34 Uhr" (3:34 PM).
2. **Windshield View**:
- **Colored Bounding Boxes**:
- Red box around a cyclist.
- Blue box around a pedestrian.
- **Directional Arrows**:
- Blue arrows indicating cyclist movement.
- Blue arrows indicating pedestrian movement.
- **Scene Elements**:
- Buildings, parked cars, and a clear sky.
### Detailed Analysis
- **Speed**: The vehicle is traveling at 32 km/h (orange value), with a maximum speed of 30 km/h (gray value).
- **Alerts**: "Bremsvorgang aktiv" (braking active) and "Achtung!" (attention) suggest the vehicle's systems are engaged in collision avoidance or hazard response.
- **Energy Performance Graph**: The red wavy line indicates fluctuating energy levels, possibly related to regenerative braking or power consumption.
- **Annotations**:
- The cyclist (red box) is positioned ahead of the vehicle, with arrows showing forward motion.
- The pedestrian (blue box) is on the sidewalk, with arrows indicating lateral movement.
### Key Observations
- The cyclist is closer to the vehicle than the pedestrian, with both annotated for tracking.
- The dashboard emphasizes energy efficiency ("Energieleistung") and active braking, suggesting an electric or hybrid vehicle.
- The time "15:34 Uhr" aligns with typical urban traffic hours.
### Interpretation
The image demonstrates an advanced driver-assistance system (ADAS) in operation. The colored bounding boxes and arrows indicate real-time object detection and trajectory prediction, critical for autonomous driving or semi-autonomous features. The dashboard alerts ("Bremsvorgang aktiv") and energy performance graph highlight the system's focus on safety and efficiency. The urban setting ("Stadtsverkehr") implies frequent stops and interactions with vulnerable road users (cyclists, pedestrians). The absence of a visible legend for the colored boxes suggests the system uses standardized color coding (red for immediate hazards, blue for secondary objects). The energy performance graph's wavy line may correlate with the cyclist's proximity, indicating adaptive energy management based on traffic conditions.