\n
## Heatmap: KL Divergence Across Layers and Generated Tokens
### Overview
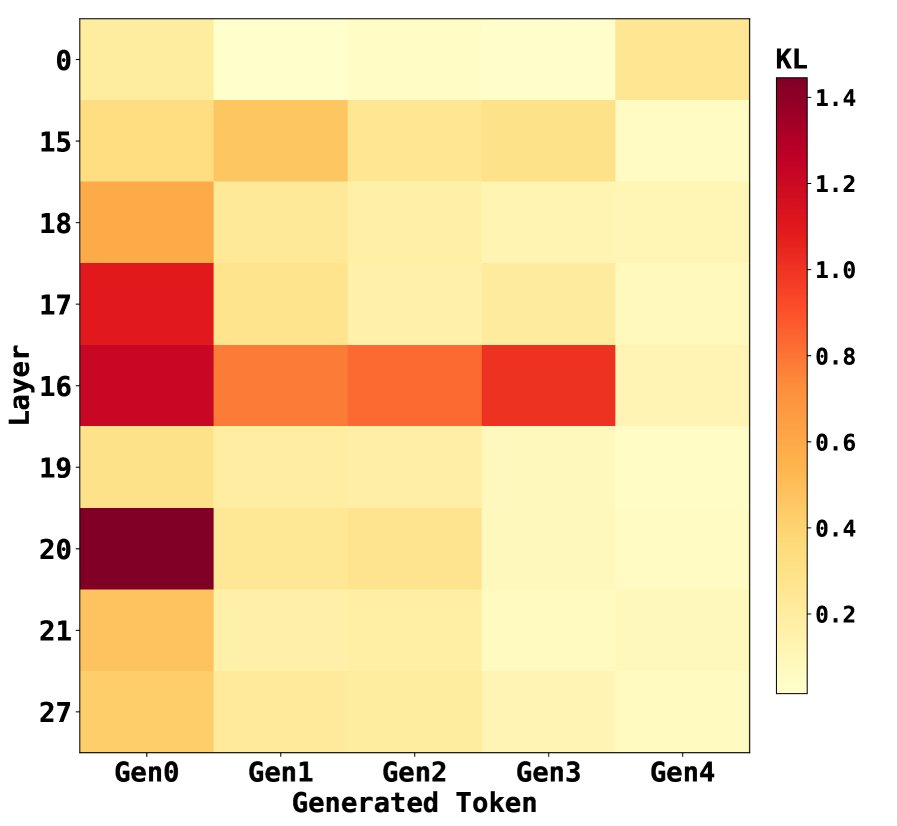
The image is a heatmap visualizing KL divergence values between two distributions (likely a model's internal representations and some reference) across different neural network layers and sequential generated tokens. The heatmap uses a color gradient from light yellow (low KL) to dark red (high KL) to represent the magnitude of divergence.
### Components/Axes
* **Chart Type:** Heatmap.
* **Title/Legend:** A vertical color bar legend is positioned on the right side of the chart, labeled **"KL"** at the top. The scale ranges from **0.2** (light yellow) at the bottom to **1.4** (dark red) at the top, with intermediate ticks at 0.4, 0.6, 0.8, 1.0, and 1.2.
* **Y-Axis (Vertical):** Labeled **"Layer"**. The axis lists specific layer numbers in a non-sequential order from top to bottom: **0, 15, 18, 17, 16, 19, 20, 21, 27**.
* **X-Axis (Horizontal):** Labeled **"Generated Token"**. The axis lists five sequential token categories from left to right: **Gen0, Gen1, Gen2, Gen3, Gen4**.
### Detailed Analysis
The heatmap is a 9x5 grid (9 layers x 5 tokens). Below is an approximate reconstruction of the KL divergence values for each cell, based on color matching to the legend. Values are estimated with uncertainty.
| Layer \ Token | Gen0 | Gen1 | Gen2 | Gen3 | Gen4 |
| :--- | :--- | :--- | :--- | :--- | :--- |
| **0** | ~0.25 (Light Yellow) | ~0.20 (Very Light Yellow) | ~0.20 (Very Light Yellow) | ~0.20 (Very Light Yellow) | ~0.35 (Light Orange) |
| **15** | ~0.35 (Light Orange) | ~0.55 (Orange) | ~0.45 (Light Orange) | ~0.40 (Light Orange) | ~0.25 (Light Yellow) |
| **18** | ~0.65 (Orange) | ~0.35 (Light Orange) | ~0.30 (Light Yellow) | ~0.25 (Light Yellow) | ~0.20 (Very Light Yellow) |
| **17** | **~1.05 (Red)** | ~0.35 (Light Orange) | ~0.30 (Light Yellow) | ~0.30 (Light Yellow) | ~0.20 (Very Light Yellow) |
| **16** | **~1.25 (Dark Red)** | ~0.75 (Red-Orange) | ~0.80 (Red-Orange) | **~1.05 (Red)** | ~0.30 (Light Yellow) |
| **19** | ~0.35 (Light Orange) | ~0.25 (Light Yellow) | ~0.20 (Very Light Yellow) | ~0.20 (Very Light Yellow) | ~0.20 (Very Light Yellow) |
| **20** | **~1.35 (Very Dark Red)** | ~0.35 (Light Orange) | ~0.40 (Light Orange) | ~0.25 (Light Yellow) | ~0.20 (Very Light Yellow) |
| **21** | ~0.60 (Orange) | ~0.30 (Light Yellow) | ~0.25 (Light Yellow) | ~0.20 (Very Light Yellow) | ~0.20 (Very Light Yellow) |
| **27** | ~0.55 (Orange) | ~0.30 (Light Yellow) | ~0.25 (Light Yellow) | ~0.25 (Light Yellow) | ~0.20 (Very Light Yellow) |
**Trend Verification per Layer:**
* **Layer 0:** Very low KL across all tokens, with a slight increase at Gen4.
* **Layer 15:** Moderate KL at Gen0 and Gen1, decreasing thereafter.
* **Layer 18:** Peaks at Gen0, then decreases steadily.
* **Layer 17:** Very high KL at Gen0, drops sharply and remains low.
* **Layer 16:** Very high KL at Gen0, dips at Gen1, rises again to a high peak at Gen3, then drops sharply at Gen4.
* **Layer 19, 20, 21, 27:** All show their highest KL at Gen0, followed by a general decrease. Layer 20 has the single highest value in the entire chart at Gen0.
### Key Observations
1. **Dominant Pattern:** For almost every layer, the highest KL divergence occurs at **Gen0** (the first generated token). This suggests the greatest distributional shift happens at the very start of generation.
2. **Peak Values:** The most intense divergence (dark red, KL > 1.0) is concentrated in **Layers 16, 17, and 20 at Gen0**. Layer 20 at Gen0 shows the maximum value (~1.35).
3. **Anomalous Series:** **Layer 16** exhibits a unique "double-peak" pattern, with high values at both Gen0 and Gen3, unlike the single-peak pattern of other layers.
4. **Convergence:** By **Gen4**, KL divergence is uniformly low (≤ 0.35) across all layers, indicating the distributions become more similar as generation progresses.
5. **Layer Grouping:** Mid-to-late layers (16, 17, 18, 20, 21) show more dramatic changes in KL across tokens compared to the very early (Layer 0) or very late (Layer 27) layers.
### Interpretation
This heatmap likely illustrates the **evolution of internal model states** during autoregressive text generation. KL divergence measures how much one probability distribution differs from another. Here, it probably compares the model's hidden state distribution at each layer for a given generated token against a reference distribution (e.g., the state for the previous token, or a base model's state).
* **What it suggests:** The model undergoes a significant internal reconfiguration (**high KL**) at the first token (**Gen0**), especially in specific middle layers (16, 17, 20). This could represent the model "committing" to a generation path or establishing context. The subsequent decrease in KL implies the model's internal representations stabilize as it generates more tokens within that context.
* **Why Layer 16 is special:** The secondary peak at Gen3 for Layer 16 might indicate a point of **mid-sequence re-evaluation or planning**, where this particular layer's representation shifts again, perhaps to maintain coherence or introduce new information.
* **Overall narrative:** The process shows a pattern of **initial high divergence followed by convergence**. The model makes a large initial adjustment, then fine-tunes its representations. The uniformity at Gen4 suggests the generation process has settled into a stable regime by the fifth token. This visualization helps identify which layers are most active at which stages of generation, providing insight into the model's internal dynamics.