# Technical Diagram Analysis
## Diagram Components and Flow
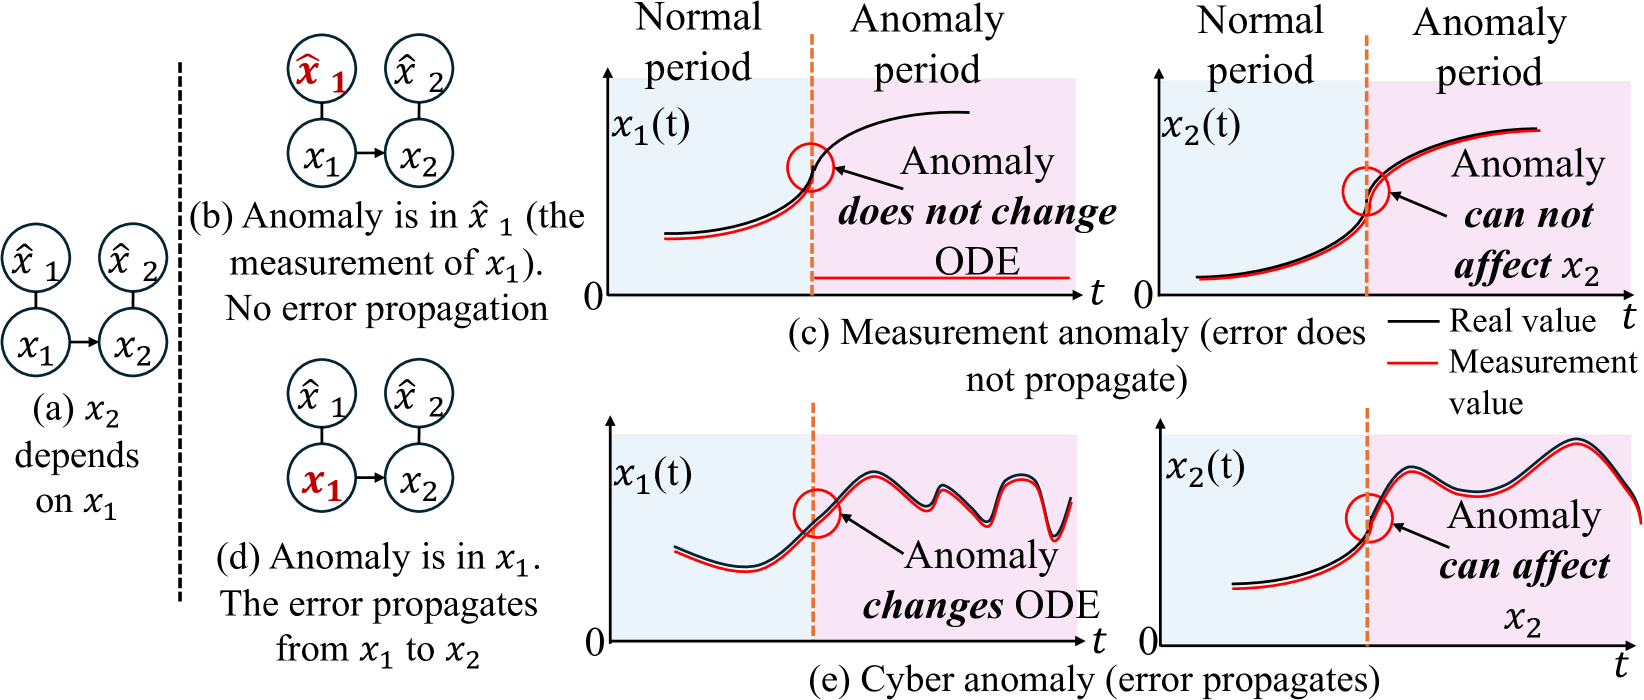
### Diagram (a)
- **Title**: `x2 depends on x1`
- **Components**:
- Two interconnected nodes:
- `x1` (source)
- `x2` (dependent)
- Arrows indicate dependency from `x1` to `x2`.
### Diagram (b)
- **Title**: `Anomaly is in x̂₁ (the measurement of x₁). No error propagation`
- **Components**:
- Two interconnected nodes:
- `x̂₁` (anomalous measurement of `x1`)
- `x2`
- Arrows show no propagation of error from `x̂₁` to `x2`.
### Diagram (d)
- **Title**: `Anomaly is in x₁. The error propagates from x₁ to x₂`
- **Components**:
- Two interconnected nodes:
- `x₁` (anomalous source)
- `x₂`
- Arrows indicate error propagation from `x₁` to `x₂`.
---
## Graphs
### Graph (c): Measurement Anomaly (Error Does Not Propagate)
- **Axes**:
- **X-axis**: `t` (time)
- Marked with:
- `Normal period` (blue region)
- `Anomaly period` (pink region, dashed orange line)
- **Y-axis**: `x₁(t)`
- **Lines**:
- **Blue**: `Real value` (consistent during anomaly)
- **Red**: `Measurement value` (deviates during anomaly)
- **Key Features**:
- Anomaly marked with a red circle at `t = t₁`.
- **Legend**:
- `Real value` (blue)
- `Measurement value` (red)
- **Text**: `Anomaly does not change ODE`
### Graph (e): Cyber Anomaly (Error Propagates)
- **Axes**:
- **X-axis**: `t` (time)
- Marked with:
- `Normal period` (blue region)
- `Anomaly period` (pink region, dashed orange line)
- **Y-axis**: `x₂(t)`
- **Lines**:
- **Blue**: `Real value` (consistent during anomaly)
- **Red**: `Measurement value` (deviates and propagates during anomaly)
- **Key Features**:
- Anomaly marked with a red circle at `t = t₁`.
- **Legend**:
- `Real value` (blue)
- `Measurement value` (red)
- **Text**: `Anomaly can affect x₂`
---
## Key Trends and Data Points
1. **Measurement Anomaly (Graph c)**:
- Measurement error (`x̂₁`) occurs in `x₁` but does not propagate to `x₂`.
- Real value (`x₁(t)`) remains stable; only the measurement deviates.
2. **Cyber Anomaly (Graph e)**:
- Anomaly in `x₁` propagates to `x₂`.
- Both real and measurement values for `x₂(t)` deviate during the anomaly period.
---
## Cross-Referenced Legend and Line Accuracy
- **Graph (c)**:
- Blue line (`Real value`) aligns with `x₁(t)` axis.
- Red line (`Measurement value`) shows deviation during anomaly.
- **Graph (e)**:
- Blue line (`Real value`) remains stable for `x₂(t)`.
- Red line (`Measurement value`) diverges, indicating error propagation.