## Bar Chart: Failure Modes
### Overview
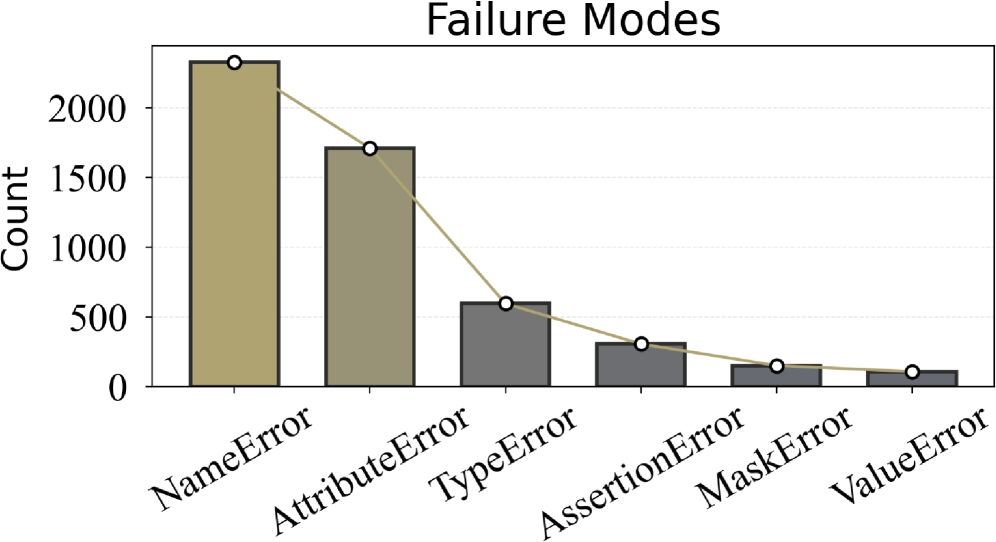
The image is a bar chart titled "Failure Modes". It displays the count of different types of errors, with the bars arranged in descending order of frequency. A line graph overlays the bar chart, connecting the top of each bar with a white circle.
### Components/Axes
* **Title:** Failure Modes
* **X-axis:** Failure Modes (NameError, AttributeError, TypeError, AssertionError, MaskError, ValueError)
* **Y-axis:** Count, with ticks at 0, 500, 1000, 1500, and 2000.
### Detailed Analysis
The chart presents the count of different failure modes. The failure modes are:
* **NameError:** The bar extends to approximately 2250.
* **AttributeError:** The bar extends to approximately 1750.
* **TypeError:** The bar extends to approximately 600.
* **AssertionError:** The bar extends to approximately 300.
* **MaskError:** The bar extends to approximately 150.
* **ValueError:** The bar extends to approximately 100.
The line graph connects the top of each bar, showing a decreasing trend from NameError to ValueError.
### Key Observations
* NameError is the most frequent failure mode, with a count of approximately 2250.
* AttributeError is the second most frequent failure mode, with a count of approximately 1750.
* TypeError, AssertionError, MaskError, and ValueError occur significantly less frequently than NameError and AttributeError.
* The counts decrease monotonically from NameError to ValueError.
### Interpretation
The chart indicates the distribution of different types of errors. NameError and AttributeError are the most common, suggesting that issues related to variable names and object attributes are the primary sources of failures. The relatively low counts of TypeError, AssertionError, MaskError, and ValueError suggest that these types of errors are less prevalent in the observed data. The decreasing trend highlights the relative importance of addressing NameError and AttributeError to reduce overall failure rates.