\n
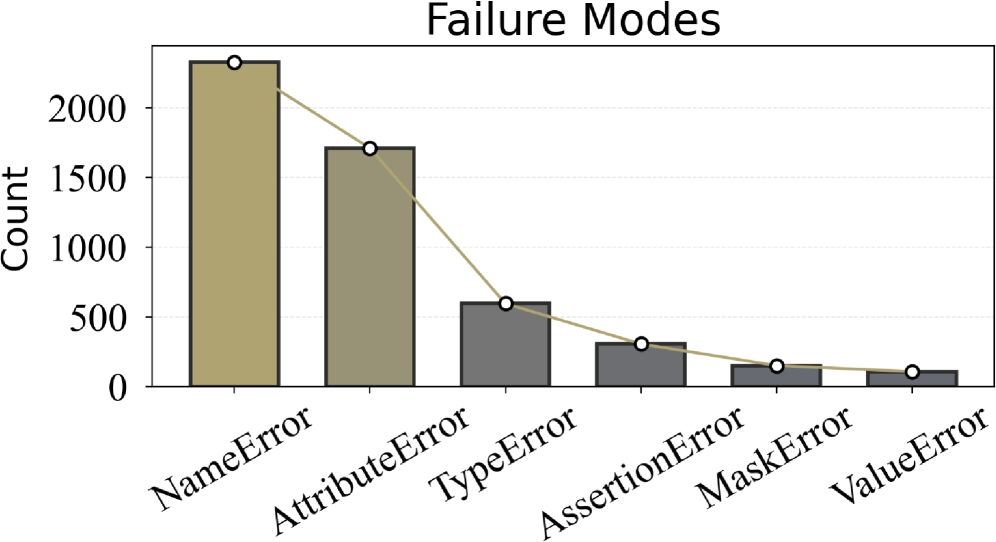
## Bar Chart: Failure Modes
### Overview
The image presents a bar chart illustrating the distribution of different failure modes. The chart displays the count of each failure type, arranged from most frequent to least frequent. A line connects the top of each bar, showing a decreasing trend in failure counts.
### Components/Axes
* **Title:** "Failure Modes" - positioned at the top-center of the chart.
* **Y-axis:** "Count" - positioned on the left side, ranging from 0 to approximately 2100, with increments of 500.
* **X-axis:** Represents the different failure modes: "NameError", "AttributeError", "TypeError", "AssertionError", "MaskError", "ValueError" - positioned at the bottom.
* **Data Series:** A single series represented by bars and a connecting line.
* **Markers:** Circular markers are placed above each bar, indicating the exact count for that failure mode.
* **Gridlines:** Horizontal gridlines are present to aid in reading the y-axis values.
### Detailed Analysis
The chart shows a significant decrease in failure counts as we move from left to right across the failure modes.
* **NameError:** Approximately 2100 count.
* **AttributeError:** Approximately 1700 count.
* **TypeError:** Approximately 600 count.
* **AssertionError:** Approximately 300 count.
* **MaskError:** Approximately 200 count.
* **ValueError:** Approximately 100 count.
The connecting line slopes downward, visually confirming the decreasing trend in failure counts.
### Key Observations
* "NameError" and "AttributeError" are the most frequent failure modes, accounting for a large proportion of all failures.
* "ValueError" is the least frequent failure mode.
* The decrease in failure counts is not linear; the drop from "NameError" to "AttributeError" is less steep than the drop from "TypeError" to "AssertionError".
### Interpretation
The data suggests that "NameError" and "AttributeError" are the primary sources of failures in the system being analyzed. Addressing these two failure modes would likely have the most significant impact on improving system reliability. The decreasing trend in failure counts across the different modes could indicate that the system is designed to catch and handle certain types of errors more effectively than others, or that the frequency of these errors is naturally lower. The relatively low count of "ValueError" suggests that the system is generally successful in validating input values. Further investigation into the root causes of "NameError" and "AttributeError" is recommended to identify and implement targeted solutions. The line connecting the bars is a visual aid to emphasize the overall trend, but it doesn't represent a separate data series. It simply highlights the decreasing frequency of failures as the failure mode changes.