## Bar Chart with Line Overlay: Failure Modes Count
### Overview
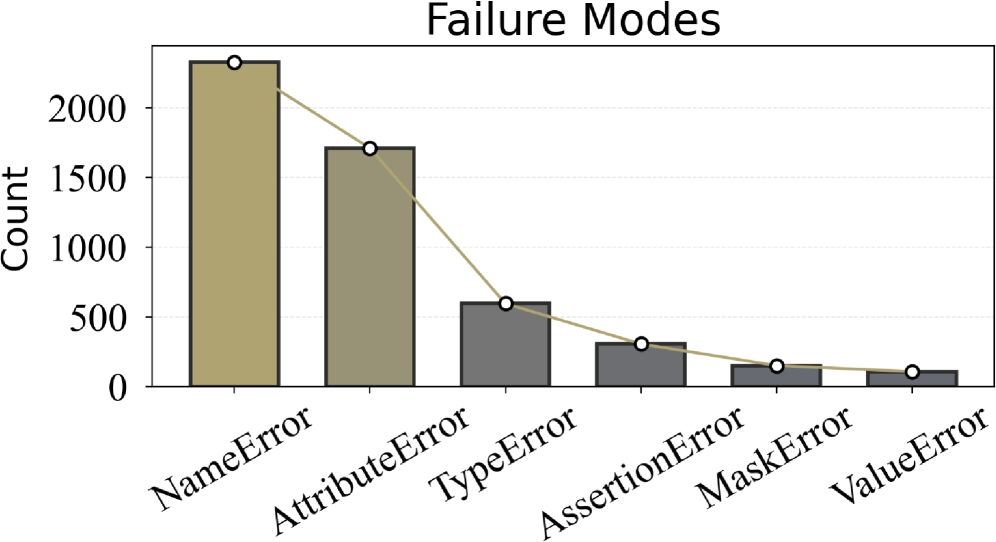
The image displays a bar chart titled "Failure Modes" that quantifies the frequency of different error types in a system. A line graph is overlaid, connecting the top of each bar to emphasize the trend. The chart shows a clear descending order of error frequency from left to right.
### Components/Axes
* **Chart Title:** "Failure Modes" (centered at the top).
* **Y-Axis:**
* **Label:** "Count" (rotated vertically on the left side).
* **Scale:** Linear scale from 0 to over 2000.
* **Tick Marks:** Major ticks at 0, 500, 1000, 1500, 2000.
* **X-Axis:**
* **Categories (from left to right):** NameError, AttributeError, TypeError, AssertionError, MaskError, ValueError.
* **Labels:** Each category label is rotated approximately 45 degrees below its corresponding bar.
* **Data Series:**
* **Bars:** Six vertical bars, one for each error type. The first two bars (NameError, AttributeError) are a light beige/khaki color. The remaining four bars (TypeError, AssertionError, MaskError, ValueError) are a dark gray.
* **Line:** A single, continuous light beige/khaki line connects a white circular marker at the top of each bar. This line visually reinforces the decreasing trend.
* **Legend:** There is no separate legend box. The color distinction between the first two bars and the rest is visual but not explicitly labeled.
### Detailed Analysis
The chart presents the following approximate counts for each failure mode, based on visual estimation against the y-axis:
1. **NameError:** The tallest bar, located at the far left. Its top aligns with a point significantly above the 2000 mark. **Estimated Count: ~2300.**
2. **AttributeError:** The second bar from the left. Its top is between the 1500 and 2000 marks, closer to 1500. **Estimated Count: ~1700.**
3. **TypeError:** The third bar. Its top is just above the 500 mark. **Estimated Count: ~600.**
4. **AssertionError:** The fourth bar. Its top is below the 500 mark. **Estimated Count: ~300.**
5. **MaskError:** The fifth bar. Its height is roughly half that of the AssertionError bar. **Estimated Count: ~150.**
6. **ValueError:** The sixth and final bar on the right, the shortest. **Estimated Count: ~100.**
**Trend Verification:** The overlaid line starts at the peak of the NameError bar and slopes downward continuously to the peak of the ValueError bar. This confirms a strict, monotonic decreasing trend in frequency across the listed error types.
### Key Observations
* **Dominant Failure Modes:** NameError and AttributeError are the most frequent errors by a large margin, together accounting for the vast majority of the total count.
* **Sharp Drop-off:** There is a significant decrease in frequency between AttributeError (~1700) and TypeError (~600).
* **Long Tail:** The last four error types (TypeError, AssertionError, MaskError, ValueError) form a "long tail" of less frequent issues.
* **Visual Grouping:** The color change after the second bar may be intended to visually separate the most common errors from the less common ones, though this is not annotated.
### Interpretation
This chart provides a prioritized view of system failures. The data suggests that issues related to **naming** (NameError - referencing an undefined variable/function) and **object attributes** (AttributeError - accessing a non-existent property/method) are the primary sources of instability or bugs in the analyzed system or codebase. These are often fundamental coding errors related to scope, imports, or API understanding.
The steep decline after these two indicates that type mismatches (TypeError), failed logical assertions (AssertionError), and issues with data masks or values (MaskError, ValueError) are comparatively less common. From a debugging or quality assurance perspective, this distribution argues for focusing initial efforts on improving code clarity, namespace management, and object interface documentation to address the most impactful failure modes first. The chart effectively communicates where the bulk of the problems lie, guiding resource allocation for fixes and testing.