## Bar Chart: Failure Modes
### Overview
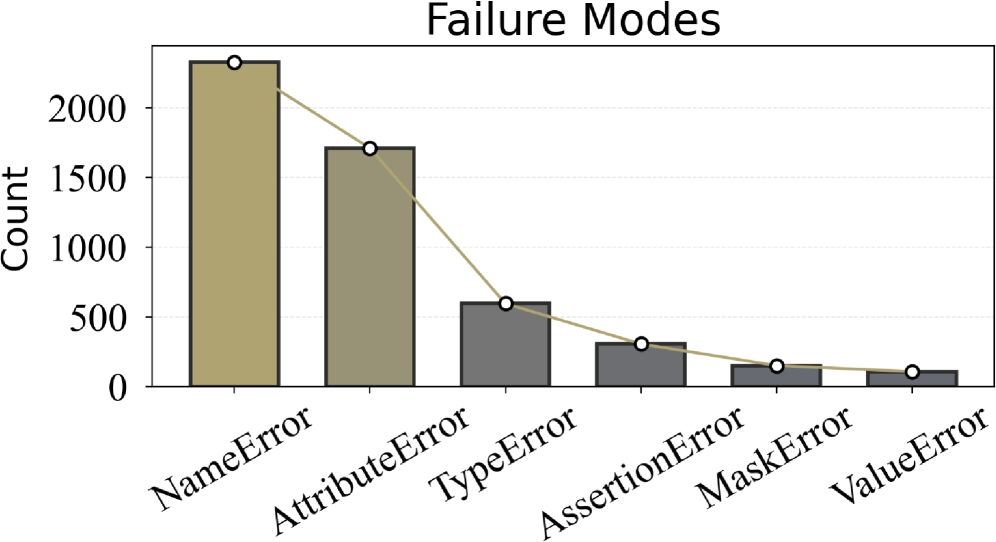
The image displays a bar chart titled "Failure Modes," visualizing the frequency of different error types in a dataset. The y-axis represents the "Count" of errors, while the x-axis lists six error categories: NameError, AttributeError, TypeError, AssertionError, MaskError, and ValueError. A line connects the data points, showing a general downward trend in error frequency.
### Components/Axes
- **Title**: "Failure Modes" (centered at the top).
- **Y-Axis**: Labeled "Count," with increments of 500 up to 2500.
- **X-Axis**: Categories include NameError, AttributeError, TypeError, AssertionError, MaskError, and ValueError.
- **Bars**:
- NameError (brown, ~2200).
- AttributeError (brown, ~1700).
- TypeError (gray, ~600).
- AssertionError (gray, ~300).
- MaskError (gray, ~150).
- ValueError (gray, ~100).
- **Line**: A single line connects the data points, sloping downward from left to right.
### Detailed Analysis
- **NameError**: Tallest bar, approximately 2200 counts (highest frequency).
- **AttributeError**: Second tallest, ~1700 counts.
- **TypeError**: ~600 counts, marking a sharp drop from the first two categories.
- **AssertionError**: ~300 counts, continuing the decline.
- **MaskError**: ~150 counts.
- **ValueError**: ~100 counts (lowest frequency).
### Key Observations
1. **Dominance of NameError and AttributeError**: These two categories account for ~80% of total errors (~3900 out of ~4850 total).
2. **Steep Decline**: The line connecting the points shows a consistent downward trend, with a ~75% reduction from NameError to ValueError.
3. **Color Shift**: The first two bars (NameError, AttributeError) are brown, while the remaining four are gray. No legend explains this distinction, suggesting it may indicate a categorical shift (e.g., input-related vs. operational errors).
### Interpretation
The data suggests that **input validation errors** (NameError, AttributeError) are the most prevalent, likely due to poor data quality or user input handling. The sharp drop in frequency for TypeError and subsequent categories implies these errors are less common but potentially more complex or context-specific. The absence of a legend for color coding leaves ambiguity about whether the brown/gray distinction reflects severity, error type, or another factor. The trend line reinforces that error frequency decreases exponentially as the error type becomes more specialized (e.g., ValueError vs. NameError). This could inform prioritization in debugging or system design, focusing on mitigating high-frequency errors first.