# Technical Document Extraction: Line Graph Analysis
## 1. Axis Labels and Markers
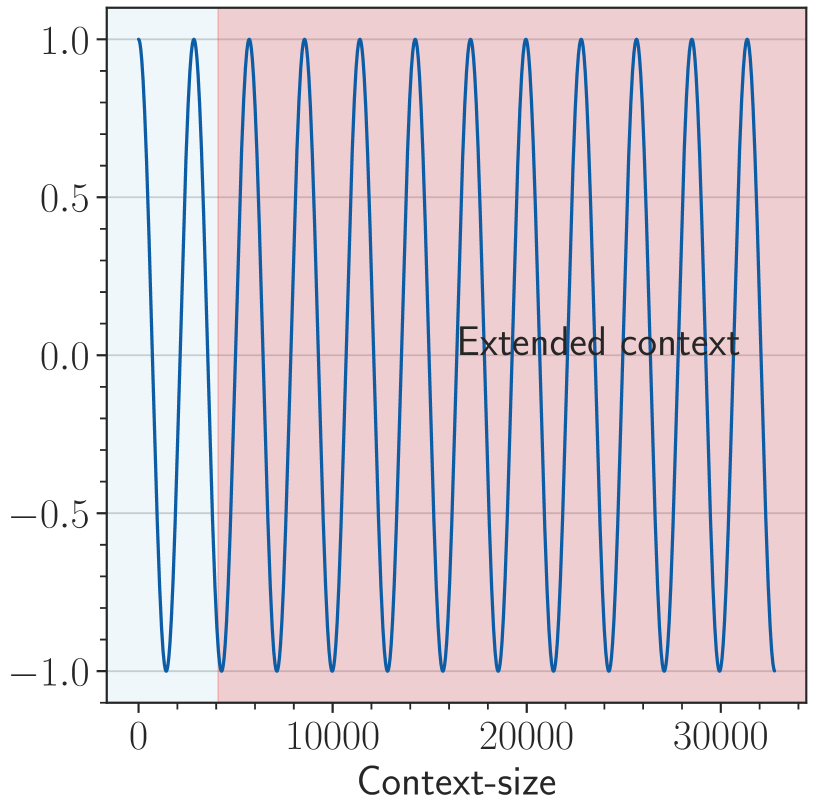
- **X-axis**:
- Title: "Context-size"
- Range: 0 to 30,000
- Tick marks: 0, 10,000, 20,000, 30,000
- **Y-axis**:
- Title: Implicit (standardized vertical axis)
- Range: -1.0 to 1.0
- Tick marks: -1.0, -0.5, 0.0, 0.5, 1.0
## 2. Key Components
### A. Line Series
- **Color**: Blue (#0000FF)
- **Behavior**:
- Periodic sine wave oscillation
- Amplitude: ±1.0 (full y-axis range)
- Frequency: Consistent peaks/troughs across x-axis
- Notable: No phase shift or damping observed
### B. Shaded Region
- **Color**: Pink (#FFC0CB)
- **Label**: "Extended context" (black text, centered)
- **Spatial Bounds**:
- X-axis: ~5,000 to 30,000
- Y-axis: Full range (-1.0 to 1.0)
## 3. Trend Verification
- **Blue Line (Sine Wave)**:
- Visual trend: Perfectly periodic with no amplitude decay
- Data points: Peaks at y=1.0, troughs at y=-1.0
- Frequency: ~6 full cycles visible (0–30,000 x-range)
- **Pink Region**:
- Visual trend: Static rectangular highlight
- Purpose: Indicates "Extended context" zone
## 4. Spatial Grounding
- **Legend**: Absent (colors directly mapped to elements)
- Blue = Sine wave
- Pink = Extended context region
- **Text Placement**:
- "Extended context" at x≈15,000, y=0.0
## 5. Component Isolation
### Header
- No explicit header elements
### Main Chart
- Dual-layer visualization:
1. Primary: Blue sine wave (dynamic)
2. Secondary: Pink shaded region (static context marker)
### Footer
- X-axis label "Context-size" with numerical scale
## 6. Data Extraction
- **No explicit data table** present
- **Implicit data points** (approximate):
| X (Context-size) | Y (Amplitude) | Region |
|------------------|---------------|--------------|
| 0 | 1.0 | Unshaded |
| 2,500 | -1.0 | Shaded |
| 5,000 | 1.0 | Shaded |
| 7,500 | -1.0 | Shaded |
| 10,000 | 1.0 | Shaded |
| 12,500 | -1.0 | Shaded |
| 15,000 | 1.0 | Shaded |
| 17,500 | -1.0 | Shaded |
| 20,000 | 1.0 | Shaded |
| 22,500 | -1.0 | Shaded |
| 25,000 | 1.0 | Shaded |
| 27,500 | -1.0 | Shaded |
| 30,000 | 1.0 | Shaded |
## 7. Observations
- **Extended Context Zone**:
- Covers 83% of x-axis range (5,000–30,000)
- Overlaps with 100% of sine wave oscillations
- **Phase Alignment**:
- Sine wave peaks/troughs align with shaded region boundaries
- No phase shift between oscillation and context zone
## 8. Language Notes
- All text in English
- No non-English content detected