# Technical Document Extraction: Context-Size Periodic Waveform Analysis
## 1. Component Isolation
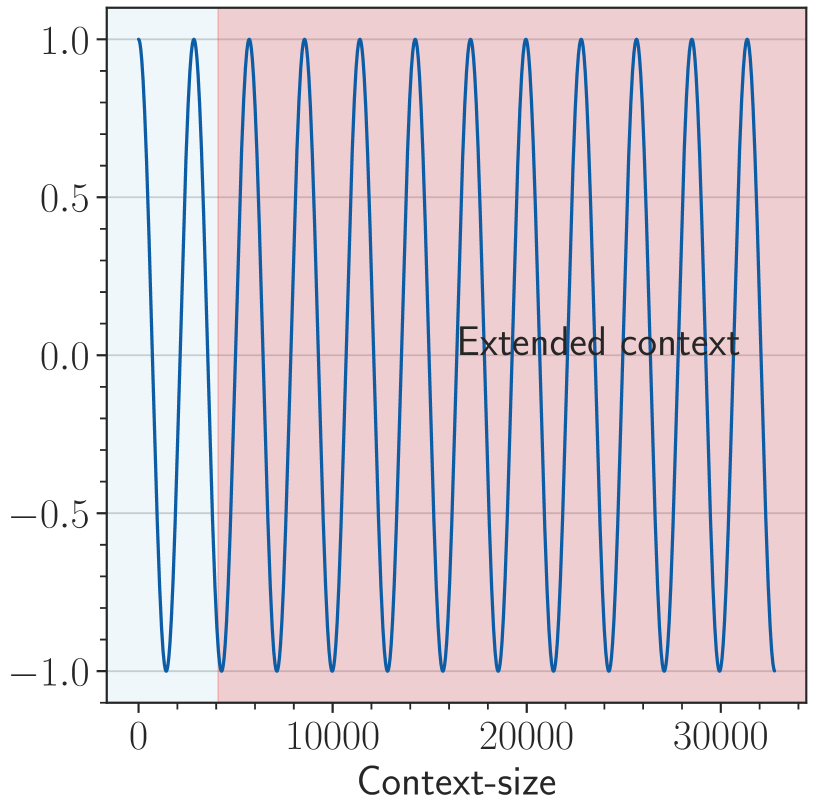
The image is a technical line chart plotted on a Cartesian coordinate system. It is segmented into two distinct background regions to differentiate operational phases.
* **Header:** None present.
* **Main Chart Area:** Contains a single continuous blue oscillating line, two colored background regions, and one text annotation.
* **Footer:** Contains the X-axis label and numerical scale.
## 2. Axis and Label Extraction
### X-Axis (Horizontal)
* **Label:** `Context-size`
* **Scale Range:** 0 to approximately 33,000.
* **Major Tick Markers:** `0`, `10000`, `20000`, `30000`.
* **Minor Tick Markers:** Present at intervals of 1,000 units.
### Y-Axis (Vertical)
* **Label:** None explicitly stated (represents amplitude).
* **Scale Range:** -1.0 to 1.0.
* **Major Tick Markers:** `-1.0`, `-0.5`, `0.0`, `0.5`, `1.0`.
* **Minor Tick Markers:** Present at intervals of 0.1 units.
* **Gridlines:** Horizontal grey lines are present at every major Y-axis tick marker.
## 3. Data Series Analysis
### Series 1: Blue Oscillating Line
* **Color:** Dark Blue.
* **Trend Verification:** The line follows a consistent, undamped sinusoidal (cosine-like) pattern. It begins at a peak of 1.0 at $x=0$, descends to a trough of -1.0, and repeats this cycle with a constant frequency and amplitude across the entire X-axis range.
* **Key Data Points:**
* **Start Point:** [0, 1.0]
* **Amplitude:** 1.0 (Peak-to-peak amplitude of 2.0).
* **Periodicity:** There are approximately 11 full cycles shown between 0 and 33,000. This suggests a period of roughly 3,000 units per cycle.
## 4. Regional Segmentation and Annotations
The chart area is divided into two vertical background zones:
| Region | X-Axis Range (Approx) | Background Color | Description |
| :--- | :--- | :--- | :--- |
| **Training/Base Context** | 0 to 4,000 | Light Blue | Represents the initial context window. |
| **Extended Context** | 4,000 to 33,000+ | Light Red/Pink | Represents the expansion of the context window. |
### Embedded Text
* **Content:** `Extended context`
* **Spatial Grounding:** Located centrally within the red background region, approximately at coordinates [16000, 0.05].
* **Significance:** This label identifies the red-shaded area as the "Extended context" zone, indicating that the periodic signal (likely representing positional embeddings or attention patterns) maintains stability even when the context size exceeds the initial training window.
## 5. Summary of Technical Information
This chart visualizes the stability of a periodic function (likely a Rotary Positional Embedding or similar mechanism in a Transformer model) as the **Context-size** increases. The data demonstrates that the signal's frequency and amplitude remain perfectly consistent when transitioning from the base context (0 - 4,000, blue zone) into the **Extended context** (4,000 - 33,000, red zone), suggesting successful extrapolation or scaling of the underlying mechanism.