## Scatter Plot: Gradient Updates vs. Dimension with Exponential and Power Law Fits
### Overview
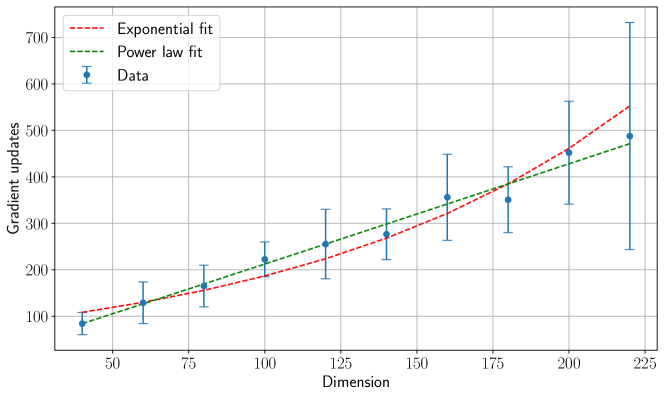
The image is a scatter plot showing the relationship between "Dimension" (x-axis) and "Gradient updates" (y-axis). The plot includes data points with error bars, along with an exponential fit and a power law fit to the data.
### Components/Axes
* **X-axis:** "Dimension", with scale markers at 50, 75, 100, 125, 150, 175, 200, and 225.
* **Y-axis:** "Gradient updates", with scale markers at 100, 200, 300, 400, 500, 600, and 700.
* **Data Points:** Blue dots with vertical error bars.
* **Exponential Fit:** Red dashed line.
* **Power Law Fit:** Green dashed line.
* **Legend:** Located in the top-left corner, identifying the data, exponential fit, and power law fit.
### Detailed Analysis
**Data Points:** The blue data points generally show an increasing trend of gradient updates as the dimension increases. The error bars indicate the uncertainty associated with each data point.
* Dimension = 40, Gradient updates = 85 +/- 20
* Dimension = 60, Gradient updates = 130 +/- 40
* Dimension = 80, Gradient updates = 160 +/- 40
* Dimension = 100, Gradient updates = 220 +/- 40
* Dimension = 120, Gradient updates = 230 +/- 40
* Dimension = 140, Gradient updates = 290 +/- 40
* Dimension = 170, Gradient updates = 350 +/- 50
* Dimension = 200, Gradient updates = 350 +/- 70
* Dimension = 220, Gradient updates = 490 +/- 220
**Exponential Fit (Red Dashed Line):** The exponential fit starts lower than the power law fit but increases more rapidly as the dimension increases.
* At Dimension = 50, Exponential Fit ≈ 100
* At Dimension = 100, Exponential Fit ≈ 200
* At Dimension = 150, Exponential Fit ≈ 320
* At Dimension = 200, Exponential Fit ≈ 450
* At Dimension = 225, Exponential Fit ≈ 550
**Power Law Fit (Green Dashed Line):** The power law fit shows a more gradual increase compared to the exponential fit.
* At Dimension = 50, Power Law Fit ≈ 100
* At Dimension = 100, Power Law Fit ≈ 200
* At Dimension = 150, Power Law Fit ≈ 300
* At Dimension = 200, Power Law Fit ≈ 400
* At Dimension = 225, Power Law Fit ≈ 450
### Key Observations
* Both the exponential and power law fits capture the general increasing trend of gradient updates with dimension.
* The exponential fit appears to increase more rapidly than the power law fit, especially at higher dimensions.
* The error bars on the data points are relatively large, indicating substantial variability in the gradient updates for a given dimension.
### Interpretation
The plot suggests that the number of gradient updates required increases with the dimension of the problem. Both exponential and power law models can be used to approximate this relationship, but the exponential model shows a more rapid increase at higher dimensions. The large error bars indicate that other factors besides dimension also influence the number of gradient updates. The choice between the exponential and power law fit may depend on the specific context and the range of dimensions being considered.