## Scatter Plot: Gradient Updates vs. Dimension
### Overview
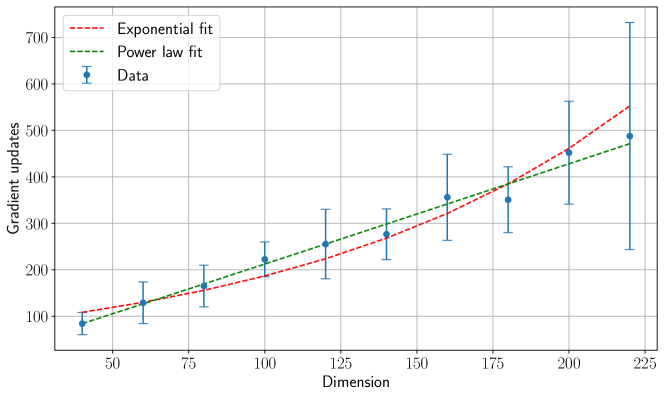
The image presents a scatter plot illustrating the relationship between the dimension of a space and the number of gradient updates required. Two fitted curves, an exponential fit and a power law fit, are overlaid on the data points. Error bars are included for each data point, representing the uncertainty in the gradient update measurements.
### Components/Axes
* **X-axis:** Dimension, ranging from approximately 25 to 225. The axis is labeled "Dimension".
* **Y-axis:** Gradient updates, ranging from approximately 50 to 700. The axis is labeled "Gradient updates".
* **Data Points:** Represented by blue circles with error bars. Labeled "Data" in the legend.
* **Exponential Fit:** Represented by a red dashed line. Labeled "Exponential fit" in the legend.
* **Power Law Fit:** Represented by a green dashed line. Labeled "Power law fit" in the legend.
* **Legend:** Located in the top-left corner of the plot.
### Detailed Analysis
The data points show a general upward trend, indicating that as the dimension increases, the number of gradient updates also increases. The error bars indicate significant variability in the gradient update measurements for each dimension.
Let's analyze the data series and fitted curves:
* **Data (Blue Circles):**
* At Dimension = 50, Gradient Updates ≈ 80 ± 20.
* At Dimension = 75, Gradient Updates ≈ 140 ± 25.
* At Dimension = 100, Gradient Updates ≈ 200 ± 30.
* At Dimension = 125, Gradient Updates ≈ 260 ± 35.
* At Dimension = 150, Gradient Updates ≈ 320 ± 40.
* At Dimension = 175, Gradient Updates ≈ 380 ± 45.
* At Dimension = 200, Gradient Updates ≈ 450 ± 50.
* At Dimension = 225, Gradient Updates ≈ 550 ± 70.
* **Exponential Fit (Red Dashed Line):** This line exhibits an accelerating upward curve.
* At Dimension = 50, Gradient Updates ≈ 70.
* At Dimension = 100, Gradient Updates ≈ 180.
* At Dimension = 150, Gradient Updates ≈ 300.
* At Dimension = 200, Gradient Updates ≈ 480.
* At Dimension = 225, Gradient Updates ≈ 600.
* **Power Law Fit (Green Dashed Line):** This line exhibits a slower, more gradual upward curve compared to the exponential fit.
* At Dimension = 50, Gradient Updates ≈ 100.
* At Dimension = 100, Gradient Updates ≈ 220.
* At Dimension = 150, Gradient Updates ≈ 330.
* At Dimension = 200, Gradient Updates ≈ 440.
* At Dimension = 225, Gradient Updates ≈ 530.
### Key Observations
* The data points generally fall between the exponential and power law fits.
* The error bars are relatively large, especially at higher dimensions, indicating greater uncertainty in the gradient update measurements.
* The exponential fit appears to more closely follow the trend of the data points at higher dimensions.
* The power law fit appears to underestimate the gradient updates at higher dimensions.
### Interpretation
The plot suggests that the number of gradient updates required to optimize a model increases with the dimensionality of the input space. The fact that both an exponential and power law fit can be applied to the data indicates that the relationship is not strictly linear. The better fit of the exponential curve at higher dimensions suggests that the complexity of the optimization problem grows more rapidly with dimension than a simple power law would predict. This could be due to phenomena like the curse of dimensionality, where the volume of the search space increases exponentially with dimension, making it more difficult to find optimal solutions. The large error bars suggest that the exact relationship between dimension and gradient updates may be sensitive to the specific model architecture, dataset, and optimization algorithm used. Further investigation would be needed to determine which fit best describes the underlying process and to understand the sources of uncertainty in the gradient update measurements.