## Line Graph: Gradient Updates vs. Dimension
### Overview
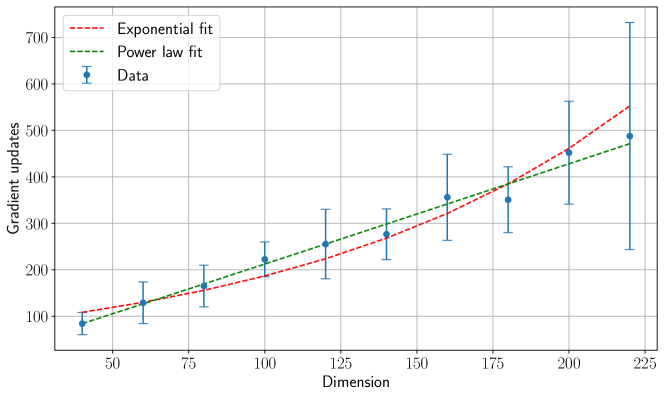
The image is a line graph comparing two mathematical models (exponential and power law fits) against empirical data points. The x-axis represents "Dimension" (ranging from 50 to 225), and the y-axis represents "Gradient updates" (ranging from 0 to 700). The graph includes a legend in the top-left corner and error bars for the data points.
### Components/Axes
- **X-axis (Dimension)**: Labeled "Dimension," with values from 50 to 225 in increments of 25.
- **Y-axis (Gradient updates)**: Labeled "Gradient updates," with values from 0 to 700 in increments of 100.
- **Legend**: Located in the top-left corner, with three entries:
- Red dashed line: Exponential fit
- Green dashed line: Power law fit
- Blue points with error bars: Data
### Detailed Analysis
1. **Exponential Fit (Red Dashed Line)**:
- Starts at ~100 gradient updates at dimension 50.
- Increases steadily, reaching ~550 at dimension 225.
- Slope becomes steeper as dimension increases.
2. **Power Law Fit (Green Dashed Line)**:
- Begins slightly below the exponential fit at dimension 50 (~90 gradient updates).
- Grows more gradually, reaching ~480 at dimension 225.
- Maintains a consistent upward trend but with a less pronounced slope.
3. **Data Points (Blue with Error Bars)**:
- Plotted at each dimension mark (50, 75, 100, ..., 225).
- Values align closely with the power law fit but show variability:
- At dimension 50: ~90 (±10).
- At dimension 225: ~490 (±110).
- Error bars increase in size as dimension increases, indicating higher uncertainty at larger dimensions.
### Key Observations
- Both fits exhibit upward trends, but the exponential fit grows faster than the power law fit.
- Data points cluster near the power law fit but occasionally exceed it, particularly at higher dimensions.
- Error bars for data points suggest increasing variability with dimension, especially at 225 (error range: 380–600).
### Interpretation
The graph demonstrates a comparison of two scaling models against empirical data. The power law fit aligns more closely with the observed data, suggesting it better captures the underlying trend. However, the data's increasing uncertainty at higher dimensions (e.g., ±110 at 225) implies potential limitations in model accuracy or external factors affecting gradient updates. The exponential fit, while steeper, may overestimate growth, highlighting the importance of model selection in predictive scenarios. The divergence between fits at higher dimensions underscores the need for further validation in extreme cases.