## Diagram: Effects of Mediators
### Overview
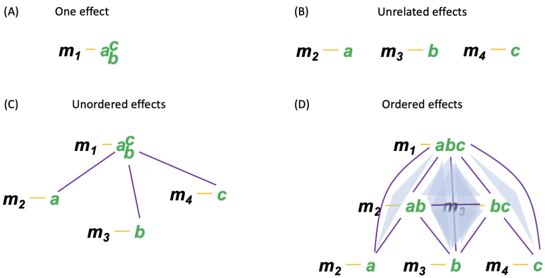
The image presents four diagrams illustrating different types of effects involving mediators (m1, m2, m3, m4) and variables (a, b, c). The diagrams show how these mediators can influence the relationships between the variables, ranging from a single effect to ordered effects.
### Components/Axes
* **Mediators:** Represented as "m1", "m2", "m3", "m4".
* **Variables:** Represented as "a", "b", "c". These are colored green.
* **Connections:** Lines indicate relationships or effects between mediators and variables. These are colored purple.
* **Diagram Titles:**
* (A) One effect
* (B) Unrelated effects
* (C) Unordered effects
* (D) Ordered effects
### Detailed Analysis
**Diagram A: One effect**
* Shows a single mediator, m1, influencing all three variables a, b, and c.
* The variables a, b, and c are grouped together and colored green.
* m1 is connected to the group of variables a, b, and c by a short horizontal line.
**Diagram B: Unrelated effects**
* Shows three mediators (m2, m3, m4) each influencing a single variable (a, b, c respectively).
* m2 is connected to a.
* m3 is connected to b.
* m4 is connected to c.
* Each connection is a short horizontal line.
**Diagram C: Unordered effects**
* Shows a single mediator, m1, influencing all three variables (a, b, c) through separate connections.
* m1 is connected to a, b, and c via purple lines.
* Each variable (a, b, c) is associated with a different mediator (m2, m3, m4 respectively).
* m2 is connected to a.
* m3 is connected to b.
* m4 is connected to c.
* Each connection is a short horizontal line.
**Diagram D: Ordered effects**
* Shows a more complex relationship where m1 influences a, b, and c, and there are intermediate effects.
* m1 is connected to the group of variables a, b, and c.
* m1 is also connected to the intermediate variables ab and bc.
* m2 is connected to a.
* m3 is connected to b.
* m4 is connected to c.
* Each connection is a short horizontal line.
* The connections between m1, ab, bc, and a, b, c are represented by curved purple lines, with the lines between m1 and ab/bc being thicker and more opaque.
### Key Observations
* The diagrams illustrate different ways in which mediators can influence variables.
* Diagram A shows a single mediator having a combined effect on all variables.
* Diagram B shows mediators having independent effects on individual variables.
* Diagram C shows a single mediator having separate, unordered effects on each variable.
* Diagram D shows a single mediator having ordered effects on each variable.
### Interpretation
The diagrams provide a visual representation of different mediation models. They highlight how the presence and arrangement of mediators can alter the relationships between variables. The progression from "One effect" to "Ordered effects" demonstrates increasing complexity in the mediation process. The ordered effects diagram (D) suggests a sequential or hierarchical influence, where the effect of m1 on a, b, and c is mediated through intermediate variables (ab and bc).