## Diagram: Causal Relationship Structures
### Overview
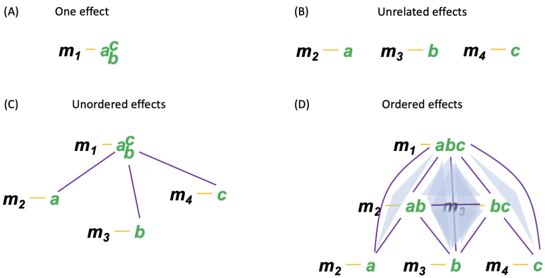
The image presents four interconnected diagrams (A-D) illustrating different causal relationship configurations between variables (m1-m4) and outcomes (a, b, c). Each quadrant demonstrates distinct interaction patterns through directed arrows and shaded regions.
### Components/Axes
- **Nodes**:
- Causes: m1, m2, m3, m4 (bold black text)
- Effects: a, b, c (green text)
- **Connections**:
- Arrows indicate causal direction (green in A, purple in C/D)
- Shaded regions in D represent combined effects
- **Quadrant Labels**:
- A: Top-left ("One effect")
- B: Top-right ("Unrelated effects")
- C: Bottom-left ("Unordered effects")
- D: Bottom-right ("Ordered effects")
### Detailed Analysis
**Quadrant A (One effect)**
- Single cause (m1) with dual effects:
`m1 → a` (green arrow)
`m1 → c` (green arrow)
- No other connections present
**Quadrant B (Unrelated effects)**
- Three independent cause-effect pairs:
`m2 → a` (green)
`m3 → b` (green)
`m4 → c` (green)
- No shared connections between nodes
**Quadrant C (Unordered effects)**
- Complex network with:
- Primary path: `m1 → a` → `c` (purple arrows)
- Secondary paths:
`m2 → a` (green)
`m3 → b` (green)
`m4 → c` (green)
- Overlapping connections suggest indirect relationships
**Quadrant D (Ordered effects)**
- Hierarchical structure with:
- Top layer: `m1 → abc` (purple)
- Intermediate:
`m2 → ab` (purple)
`m3 → bc` (purple)
- Base:
`m2 → a` (green)
`m3 → b` (green)
`m4 → c` (green)
- Shaded regions indicate cumulative influence zones
### Key Observations
1. **Color Coding**:
- Green arrows represent direct effects
- Purple arrows denote compounded/indirect effects
- Shaded areas in D show overlapping influence zones
2. **Progression Pattern**:
- From simple (A) → independent (B) → networked (C) → integrated (D)
- Increasing complexity in causal relationships
3. **Structural Hierarchy**:
- D demonstrates a three-tiered system where:
- m1 governs all outcomes
- m2/m3 govern dual outcomes
- m4 governs single outcome
### Interpretation
This diagram illustrates a framework for analyzing causal systems:
1. **Simplicity to Complexity**: Shows evolutionary stages of causal modeling
2. **Integration Mechanisms**: D's shaded overlaps suggest synergistic effects
3. **Dependency Mapping**: The ordered structure in D reveals how individual causes combine to produce compounded outcomes
4. **Redundancy Analysis**: B's unrelated effects highlight potential for parallel processing
The progression from A to D demonstrates how increasing complexity in causal relationships requires more sophisticated modeling approaches, with D representing a system where multiple causes interact to produce combined effects through both direct and mediated pathways.