## Stacked Bar Chart: Compression Ratios for kvtc Configurations
### Overview
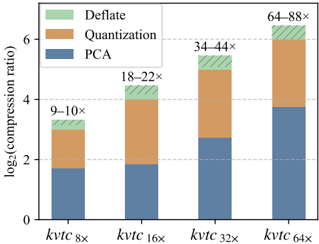
This image is a stacked bar chart illustrating the total compression ratio achieved by different "kvtc" configurations. The chart breaks down the total compression into three distinct components: PCA (Principal Component Analysis), Quantization, and Deflate. The Y-axis represents the compression ratio on a $\log_2$ scale, while the X-axis represents four specific configuration tiers.
### Components/Axes
* **Y-Axis**: Labeled "$\log_2(\text{compression ratio})$". The scale is linear, marked at intervals of 0, 2, 4, and 6.
* **X-Axis**: Categorical, displaying four configurations: $kvtc_{8\times}$, $kvtc_{16\times}$, $kvtc_{32\times}$, and $kvtc_{64\times}$.
* **Legend (Top-Left)**:
* **Green (hatched pattern)**: Deflate
* **Orange (solid)**: Quantization
* **Blue (solid)**: PCA
* **Data Labels (Top of each bar)**:
* $kvtc_{8\times}$: 9–10$\times$
* $kvtc_{16\times}$: 18–22$\times$
* $kvtc_{32\times}$: 34–44$\times$
* $kvtc_{64\times}$: 64–88$\times$
### Detailed Analysis
The chart displays four bars, each representing a specific configuration. The total height of each bar corresponds to the $\log_2$ of the compression ratio.
1. **$kvtc_{8\times}$ (Far Left)**:
* **Visual Trend**: The bar reaches a height of approximately 3.3 on the Y-axis.
* **Composition**: PCA (Blue) accounts for ~1.7 units; Quantization (Orange) accounts for ~1.3 units; Deflate (Green) accounts for ~0.3 units.
* **Total**: Corresponds to the label "9–10$\times$".
2. **$kvtc_{16\times}$ (Center-Left)**:
* **Visual Trend**: The bar reaches a height of approximately 4.5 on the Y-axis.
* **Composition**: PCA (Blue) accounts for ~1.8 units; Quantization (Orange) accounts for ~2.2 units; Deflate (Green) accounts for ~0.5 units.
* **Total**: Corresponds to the label "18–22$\times$".
3. **$kvtc_{32\times}$ (Center-Right)**:
* **Visual Trend**: The bar reaches a height of approximately 5.5 on the Y-axis.
* **Composition**: PCA (Blue) accounts for ~2.7 units; Quantization (Orange) accounts for ~2.3 units; Deflate (Green) accounts for ~0.5 units.
* **Total**: Corresponds to the label "34–44$\times$".
4. **$kvtc_{64\times}$ (Far Right)**:
* **Visual Trend**: The bar reaches a height of approximately 6.5 on the Y-axis.
* **Composition**: PCA (Blue) accounts for ~3.7 units; Quantization (Orange) accounts for ~2.3 units; Deflate (Green) accounts for ~0.5 units.
* **Total**: Corresponds to the label "64–88$\times$".
### Key Observations
* **Dominant Component**: PCA (Blue) is the primary driver of compression. As the configuration scales from $kvtc_{8\times}$ to $kvtc_{64\times}$, the PCA component shows the most consistent and significant growth.
* **Plateauing Components**: The Quantization (Orange) component increases between $kvtc_{8\times}$ and $kvtc_{16\times}$ but remains relatively stable (plateaus) from $kvtc_{16\times}$ through $kvtc_{64\times}$.
* **Minor Component**: The Deflate (Green) component is the smallest contributor across all configurations and remains nearly constant in its contribution to the total compression ratio.
### Interpretation
The data demonstrates that the "kvtc" compression pipeline is designed to scale primarily through the PCA component. Because the Y-axis is logarithmic ($\log_2$), the linear increase in the total height of the bars indicates an exponential increase in the actual compression ratio (as confirmed by the labels 9–10$\times$ to 64–88$\times$).
The fact that Quantization and Deflate contributions flatten out suggests that these methods reach a point of diminishing returns or are capped by the configuration, leaving PCA as the scalable variable to achieve higher compression ratios in the $kvtc$ architecture.