## Diagram: LLM Evaluation Metrics
### Overview
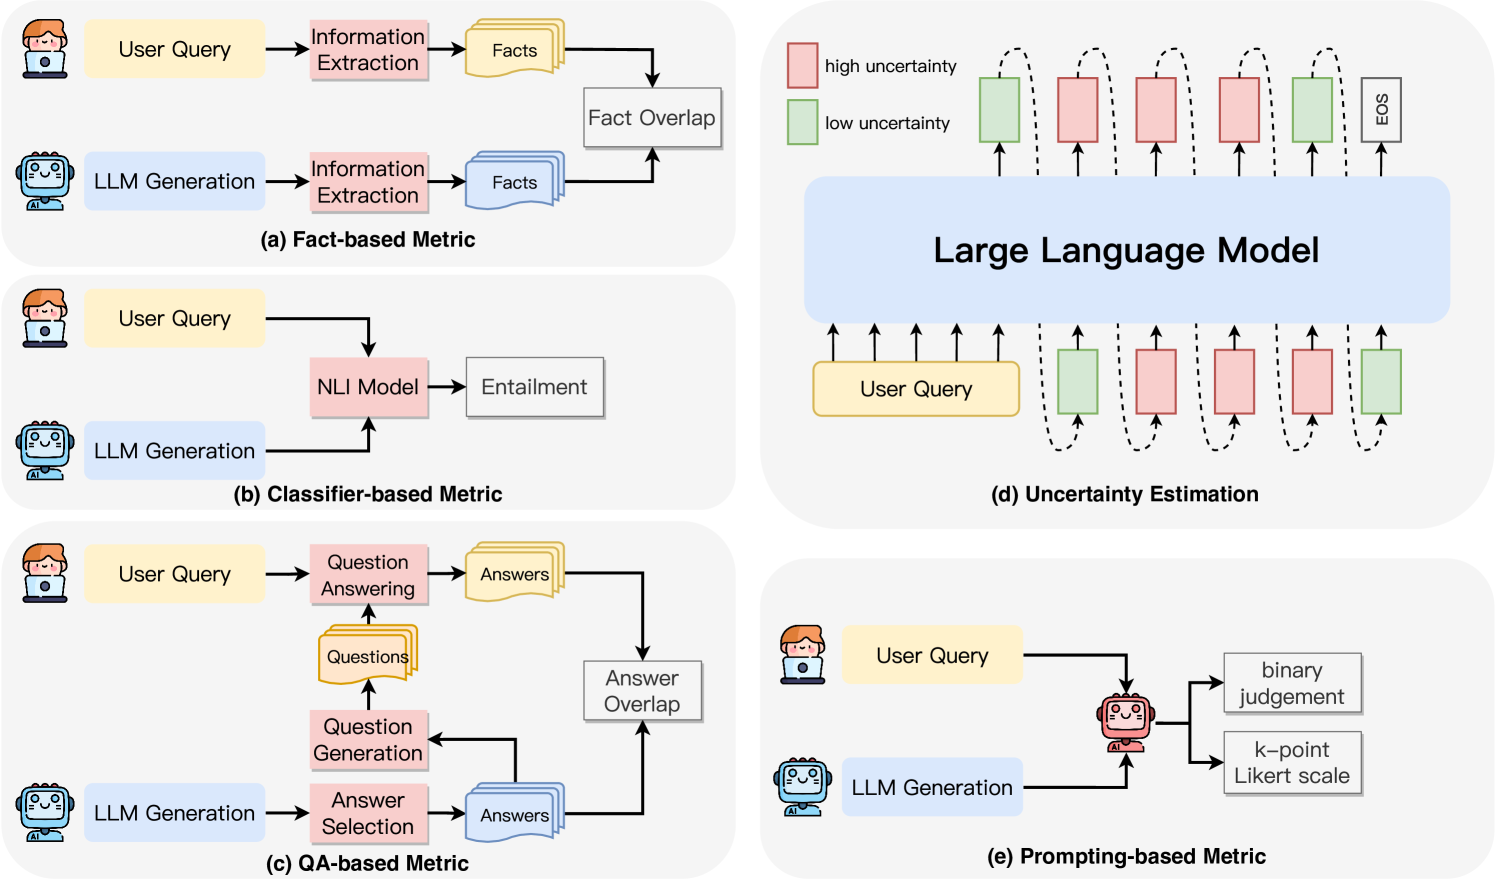
The image presents five different diagrams illustrating various methods for evaluating Large Language Models (LLMs). Each diagram depicts a different metric: Fact-based, Classifier-based, QA-based, Uncertainty Estimation, and Prompting-based. The diagrams use flowcharts to show the process and components involved in each evaluation method.
### Components/Axes
**General Components:**
* **User Query:** Represented as a yellow rounded rectangle.
* **LLM Generation:** Represented as a blue rounded rectangle with a robot icon.
* **Process Boxes:** Represented as pink/grey rounded rectangles, indicating specific operations or models.
* **Data/Output:** Represented as grey/yellow document icons or rounded rectangles.
* **Arrows:** Indicate the flow of information or processes.
**Specific Components and Labels:**
* **(a) Fact-based Metric:**
* Information Extraction (pink box)
* Facts (yellow document icon)
* Fact Overlap (grey box)
* **(b) Classifier-based Metric:**
* NLI Model (pink box)
* Entailment (grey rounded rectangle)
* **(c) QA-based Metric:**
* Question Answering (pink box)
* Answers (yellow document icon)
* Questions (yellow document icon)
* Question Generation (pink box)
* Answer Selection (pink box)
* Answer Overlap (grey box)
* **(d) Uncertainty Estimation:**
* Large Language Model (blue rounded rectangle)
* High Uncertainty (red rounded rectangle)
* Low Uncertainty (green rounded rectangle)
* EOS (grey rounded rectangle)
* **(e) Prompting-based Metric:**
* Binary Judgement (grey rounded rectangle)
* k-point Likert scale (grey rounded rectangle)
**Legend (Top Right):**
* **High Uncertainty:** Red rounded rectangle.
* **Low Uncertainty:** Green rounded rectangle.
### Detailed Analysis
**Diagram (a): Fact-based Metric**
1. A User Query is input.
2. Information Extraction is performed on the User Query.
3. The extracted information is represented as Facts.
4. The LLM Generation also undergoes Information Extraction.
5. The extracted information is represented as Facts.
6. The Facts from both the User Query and LLM Generation are compared using Fact Overlap.
**Diagram (b): Classifier-based Metric**
1. A User Query is input.
2. An LLM Generation is produced.
3. Both the User Query and LLM Generation are fed into an NLI Model.
4. The output of the NLI Model is Entailment.
**Diagram (c): QA-based Metric**
1. A User Query is input.
2. Question Answering is performed, resulting in Answers.
3. The User Query also undergoes Question Generation, resulting in Questions.
4. The LLM Generation undergoes Answer Selection, resulting in Answers.
5. The Answers from Question Answering and Answer Selection are compared using Answer Overlap.
**Diagram (d): Uncertainty Estimation**
1. A User Query is input into a Large Language Model.
2. The Large Language Model processes the query and generates tokens.
3. Each token is associated with an uncertainty level, represented by either a red (high uncertainty) or green (low uncertainty) rounded rectangle.
4. The sequence ends with an EOS (End of Sentence) token.
5. The uncertainty levels are estimated for each token.
**Diagram (e): Prompting-based Metric**
1. A User Query is input.
2. An LLM Generation is produced.
3. The LLM Generation is evaluated using either a binary judgement or a k-point Likert scale.
### Key Observations
* Each metric focuses on a different aspect of LLM evaluation.
* The Fact-based and QA-based metrics involve comparing information extracted from both the user query and the LLM's output.
* The Classifier-based metric uses an NLI model to determine the relationship between the user query and the LLM's output.
* The Uncertainty Estimation metric focuses on quantifying the model's confidence in its generated tokens.
* The Prompting-based metric relies on human evaluation using binary judgements or Likert scales.
### Interpretation
The diagrams illustrate a range of methods for evaluating LLMs, from automated approaches like fact overlap and NLI models to more subjective methods like human evaluation. The choice of metric depends on the specific evaluation goals. For example, the Fact-based metric is useful for assessing the factual accuracy of LLM generations, while the Uncertainty Estimation metric can help identify areas where the model is less confident. The diagrams highlight the complexity of LLM evaluation and the need for diverse approaches to assess different aspects of model performance.