## Flowchart Diagram: LLM Evaluation Metrics Framework
### Overview
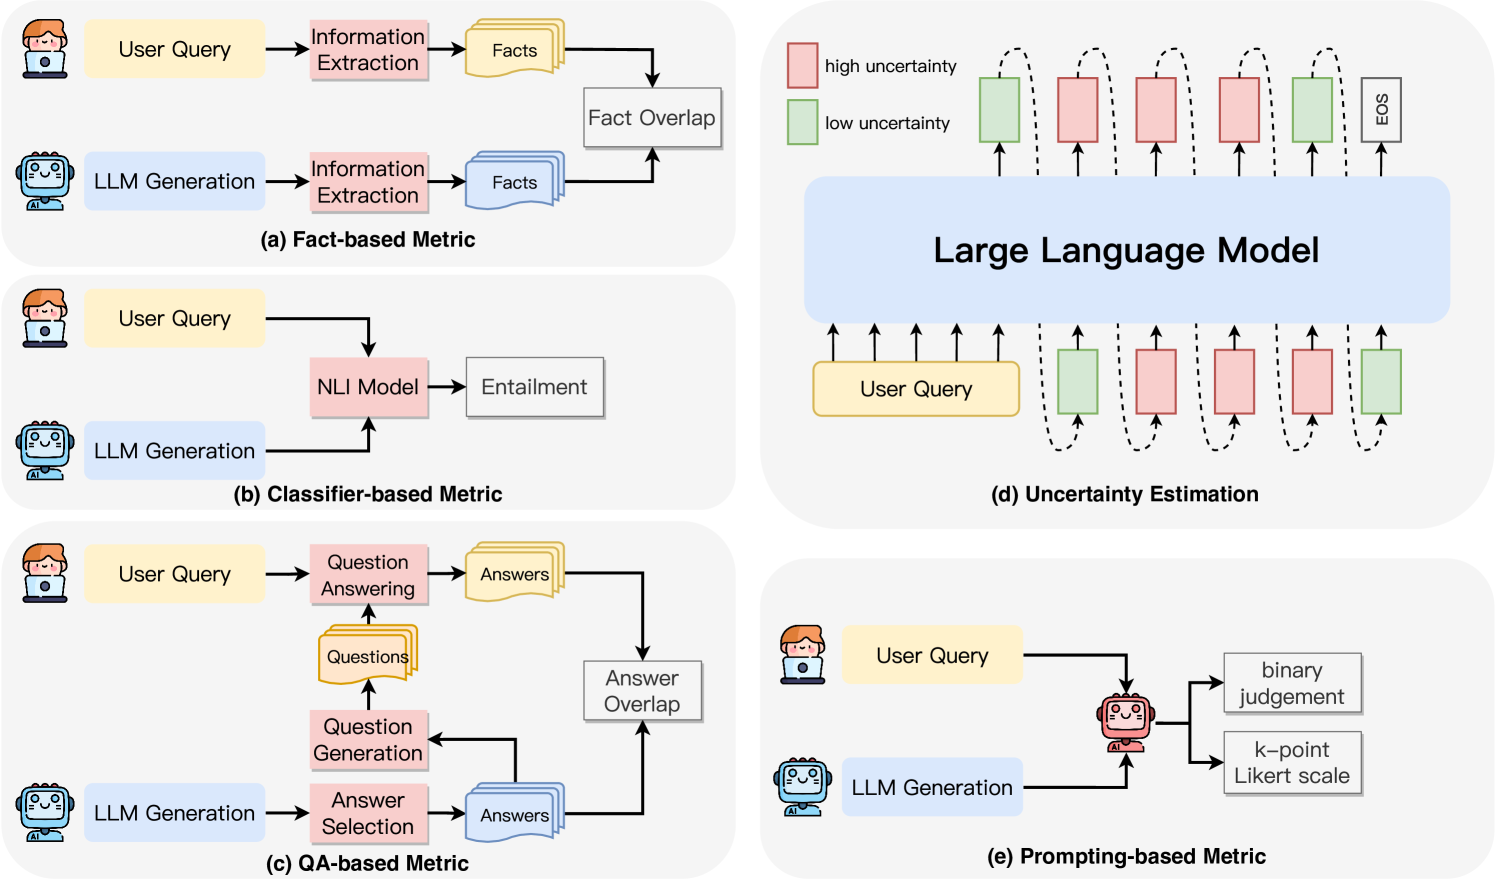
The image presents a technical framework for evaluating Large Language Models (LLMs) through four distinct metrics: Fact-based, Classifier-based, QA-based, and Prompting-based. Each metric is represented as a flowchart with interconnected components, illustrating how user queries are processed and evaluated.
### Components/Axes
#### Diagram (a): Fact-based Metric
- **Components**:
- User Query → Information Extraction → Facts → Fact Overlap → LLM Generation
- Arrows indicate sequential processing: User input is parsed for facts, compared for overlap, then fed into LLM generation.
#### Diagram (b): Classifier-based Metric
- **Components**:
- User Query → NLI Model → Entailment → LLM Generation
- Focuses on natural language inference (NLI) to assess entailment relationships.
#### Diagram (c): QA-based Metric
- **Components**:
- User Query → Question Answering → Answers → Question Generation → Answer Selection → Answer Overlap → LLM Generation
- Involves iterative question-answer cycles to validate responses.
#### Diagram (d): Uncertainty Estimation
- **Components**:
- User Query → Large Language Model → High/Low Uncertainty Indicators → EOS (End of Sequence)
- Visualizes uncertainty via color-coded blocks (red = high, green = low) and dashed lines.
#### Diagram (e): Prompting-based Metric
- **Components**:
- User Query → LLM Generation → Binary Judgement / k-point Likert Scale
- Evaluates responses using binary or Likert-scale ratings.
### Detailed Analysis
- **Fact Overlap** (a): Measures factual consistency by comparing extracted facts against LLM outputs.
- **Entailment** (b): Uses NLI models to determine if LLM outputs logically follow from user queries.
- **Answer Overlap** (c): Validates answers by comparing generated responses with ground-truth data.
- **Uncertainty Indicators** (d): Highlights model confidence levels through visual cues (e.g., red/green blocks).
- **Likert Scale** (e): Quantifies subjective quality assessments of LLM outputs.
### Key Observations
1. **Flow Direction**: All diagrams follow a left-to-right flow, starting with user input and ending with LLM evaluation.
2. **Color Coding**: Diagram (d) uses red (high uncertainty) and green (low uncertainty) to represent confidence levels.
3. **Iterative Processes**: Diagram (c) includes feedback loops (e.g., Answer Overlap → Question Generation).
4. **Evaluation Diversity**: Metrics span factual accuracy (a), logical consistency (b), QA robustness (c), and uncertainty awareness (d).
### Interpretation
This framework emphasizes multi-dimensional LLM evaluation, addressing:
- **Factual Consistency**: Ensuring outputs align with verified facts (a).
- **Logical Coherence**: Validating entailment relationships (b).
- **QA Robustness**: Testing iterative question-answer cycles (c).
- **Uncertainty Transparency**: Visualizing model confidence (d).
- **Subjective Quality**: Incorporating human-like ratings (e).
The diagrams suggest a holistic approach to LLM assessment, balancing objective metrics (fact overlap, entailment) with subjective evaluations (Likert scale). Diagram (d) uniquely highlights uncertainty estimation, critical for high-stakes applications where model confidence impacts decision-making.