## Bar Chart: Average Lengths for Correct and Incorrect Thoughts
### Overview
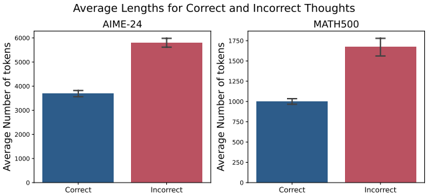
The image presents two bar charts comparing the average lengths (in tokens) of "correct" and "incorrect" thoughts for two datasets: AIME-24 and MATH500. Each chart displays two bars, one for correct thoughts (blue) and one for incorrect thoughts (red), with error bars indicating variability.
### Components/Axes
* **Title:** Average Lengths for Correct and Incorrect Thoughts
* **X-axis:** Categorical axis with two categories: "Correct" and "Incorrect".
* **Y-axis:** "Average Number of tokens".
* Left Chart (AIME-24): Scale ranges from 0 to 6000, with implicit increments of 1000.
* Right Chart (MATH500): Scale ranges from 0 to 1750, with implicit increments of 250.
* **Error Bars:** Represent variability (likely standard error or standard deviation) for each bar.
* **Chart Titles:**
* Left Chart: AIME-24
* Right Chart: MATH500
* **Bar Colors:**
* Correct: Blue
* Incorrect: Red
### Detailed Analysis
**Left Chart (AIME-24):**
* **Correct Thoughts (Blue):** The bar extends to approximately 3700 tokens. The error bar extends from approximately 3600 to 3800 tokens.
* **Incorrect Thoughts (Red):** The bar extends to approximately 5800 tokens. The error bar extends from approximately 5700 to 5900 tokens.
**Right Chart (MATH500):**
* **Correct Thoughts (Blue):** The bar extends to approximately 1000 tokens. The error bar extends from approximately 975 to 1025 tokens.
* **Incorrect Thoughts (Red):** The bar extends to approximately 1700 tokens. The error bar extends from approximately 1650 to 1750 tokens.
### Key Observations
* In both datasets (AIME-24 and MATH500), the average length of "incorrect" thoughts is significantly higher than the average length of "correct" thoughts.
* The difference in average length between "correct" and "incorrect" thoughts appears more pronounced in the MATH500 dataset compared to the AIME-24 dataset.
* The error bars are relatively small, suggesting consistent trends within each category.
### Interpretation
The data suggests that, for both AIME-24 and MATH500 datasets, incorrect thoughts tend to be more verbose or require more tokens to express than correct thoughts. This could indicate that incorrect solutions involve more complex reasoning paths, more attempts, or more detailed explanations of flawed logic. The MATH500 dataset shows a more substantial difference, potentially indicating that the nature of mathematical problem-solving leads to more extensive incorrect thought processes compared to the AIME-24 dataset. The small error bars suggest that this is a consistent trend across the data.