\n
## Bar Chart: Average Lengths for Correct and Incorrect Thoughts
### Overview
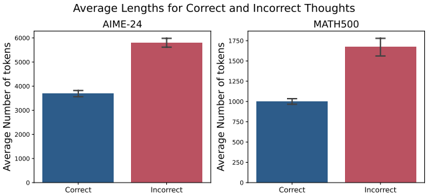
The image presents a comparative bar chart illustrating the average number of tokens used in "correct" versus "incorrect" thought processes across two datasets: AIME-24 and MATH500. Each dataset is represented by a pair of bar charts, one for correct thoughts and one for incorrect thoughts. Error bars are included on each bar, indicating the standard error or confidence interval.
### Components/Axes
* **Title:** "Average Lengths for Correct and Incorrect Thoughts" (centered at the top)
* **X-axis Label (both charts):** "Correct" and "Incorrect" (categorical)
* **Y-axis Label (both charts):** "Average Number of tokens" (numerical, ranging from 0 to approximately 2000)
* **Dataset Labels:** "AIME-24" (top-left chart) and "MATH500" (top-right chart)
* **Bar Colors:** Blue for "Correct" thoughts, Red for "Incorrect" thoughts.
* **Error Bars:** Black vertical lines extending above and below each bar, representing the uncertainty in the average.
### Detailed Analysis
**AIME-24 Dataset (Left Chart):**
* **Correct Thoughts (Blue Bar):** The blue bar representing correct thoughts has a height of approximately 3400 tokens. The error bar extends from roughly 3200 to 3600 tokens.
* **Incorrect Thoughts (Red Bar):** The red bar representing incorrect thoughts has a height of approximately 5800 tokens. The error bar extends from roughly 5500 to 6100 tokens.
**MATH500 Dataset (Right Chart):**
* **Correct Thoughts (Blue Bar):** The blue bar representing correct thoughts has a height of approximately 1050 tokens. The error bar extends from roughly 950 to 1150 tokens.
* **Incorrect Thoughts (Red Bar):** The red bar representing incorrect thoughts has a height of approximately 1800 tokens. The error bar extends from roughly 1650 to 1950 tokens.
### Key Observations
* In both datasets (AIME-24 and MATH500), incorrect thoughts consistently have a higher average number of tokens than correct thoughts.
* The difference in average token count between correct and incorrect thoughts is much more pronounced in the AIME-24 dataset than in the MATH500 dataset.
* The error bars suggest that the differences observed are statistically significant, as they do not overlap substantially.
### Interpretation
The data suggests that, on average, incorrect thought processes require a greater number of tokens (words or sub-word units) to express compared to correct thought processes. This could indicate that incorrect reasoning involves more complex, convoluted, or exploratory steps, leading to longer chains of thought. The larger difference observed in the AIME-24 dataset might imply that the problems in this dataset are more susceptible to lengthy, incorrect reasoning paths.
The use of token count as a proxy for thought length is interesting. It suggests a quantifiable measure of cognitive effort or complexity. The error bars provide a measure of the variability in thought length, indicating that not all correct or incorrect thoughts are equally concise or verbose.
The relationship between thought length and correctness could be explored further to understand the cognitive processes underlying problem-solving. It's possible that overly lengthy thoughts are more prone to errors, or that certain types of errors necessitate longer explanations.