\n
## Bar Chart: Average Lengths for Correct and Incorrect Thoughts
### Overview
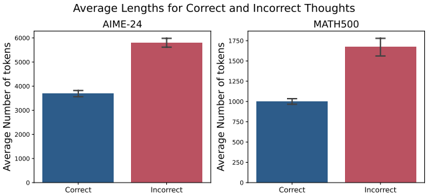
The image displays a grouped bar chart comparing the average number of tokens (a measure of text length) for "Correct" versus "Incorrect" thoughts or responses across two distinct datasets or problem sets: "AIME-24" and "MATH500". The chart is divided into two side-by-side panels, one for each dataset.
### Components/Axes
* **Title:** "Average Lengths for Correct and Incorrect Thoughts" (centered at the top).
* **Y-Axis (Both Panels):** Labeled "Average Number of Tokens". The scale and range differ between the two panels.
* **X-Axis (Both Panels):** Two categorical labels: "Correct" and "Incorrect".
* **Data Series (Legend):** There is no separate legend box. The color coding is consistent and implicit:
* **Blue Bars:** Represent "Correct" thoughts.
* **Red Bars:** Represent "Incorrect" thoughts.
* **Error Bars:** Each bar has a black, vertical error bar (likely representing standard error or standard deviation) centered at the top of the bar.
* **Panel Labels:** The dataset name is printed at the top center of each panel: "AIME-24" (left panel) and "MATH500" (right panel).
### Detailed Analysis
**Panel 1: AIME-24 (Left)**
* **Y-Axis Scale:** Ranges from 0 to 6000, with major tick marks every 1000 units.
* **Correct (Blue Bar):** The bar height indicates an average of approximately **3500 tokens**. The error bar extends roughly ±200 tokens from the top of the bar.
* **Incorrect (Red Bar):** The bar height indicates an average of approximately **5900 tokens**. The error bar is larger, extending roughly ±300 tokens from the top of the bar.
**Panel 2: MATH500 (Right)**
* **Y-Axis Scale:** Ranges from 0 to 1750, with major tick marks every 250 units.
* **Correct (Blue Bar):** The bar height indicates an average of approximately **1000 tokens**. The error bar extends roughly ±100 tokens from the top of the bar.
* **Incorrect (Red Bar):** The bar height indicates an average of approximately **1600 tokens**. The error bar is larger, extending roughly ±150 tokens from the top of the bar.
### Key Observations
1. **Consistent Trend:** In both the AIME-24 and MATH500 datasets, the average length (in tokens) for **Incorrect thoughts is substantially greater** than for Correct thoughts.
2. **Magnitude of Difference:** The relative difference is pronounced. In AIME-24, incorrect thoughts are ~69% longer on average. In MATH500, they are ~60% longer.
3. **Scale Difference:** The absolute token counts are much higher for the AIME-24 dataset (thousands of tokens) compared to the MATH500 dataset (hundreds of tokens), suggesting the problems or required responses in AIME-24 are inherently more complex or verbose.
4. **Variability:** The error bars for "Incorrect" thoughts are visually larger than those for "Correct" thoughts in both panels, indicating greater variability in the length of incorrect responses.
### Interpretation
The data suggests a strong correlation between response length and correctness in the context of these mathematical problem sets. Specifically, **incorrect solutions or reasoning chains tend to be longer** than correct ones.
This pattern could indicate several underlying phenomena:
* **Overcomplication:** Incorrect approaches may involve more convoluted, inefficient, or meandering reasoning, leading to longer text generation.
* **Lack of Precision:** Correct solutions might be more direct and precise, requiring fewer tokens to articulate the essential steps.
* **Error in Reasoning:** The process of arriving at an incorrect answer might involve more speculative or exploratory text that doesn't converge on a solution efficiently.
The consistent trend across two different datasets (AIME-24 and MATH500) strengthens the observation. The larger variability in incorrect response lengths further supports the idea that there are many more ways to be wrong (leading to diverse, lengthy outputs) than there are to be correct (which may follow a more constrained, efficient path). This insight is valuable for evaluating model performance, suggesting that verbosity alone is not an indicator of quality and may, in fact, be a signal of potential error.